Time Warner Cable 2009 Annual Report Download - page 50
Download and view the complete annual report
Please find page 50 of the 2009 Time Warner Cable annual report below. You can navigate through the pages in the report by either clicking on the pages listed below, or by using the keyword search tool below to find specific information within the annual report.-
 1
1 -
2
-
3
-
4
-
5
-
6
-
7
-
8
-
9
-
10
-
11
-
12
-
13
-
14
-
15
-
16
-
17
-
18
-
19
-
20
-
21
-
22
-
23
-
24
-
25
-
26
-
27
-
28
-
29
-
30
-
31
-
32
-
33
-
34
-
35
-
36
-
37
-
38
-
39
-
 40
40 -
 41
41 -
 42
42 -
 43
43 -
 44
44 -
 45
45 -
 46
46 -
 47
47 -
 48
48 -
 49
49 -
 50
50 -
 51
51 -
 52
52 -
 53
53 -
 54
54 -
 55
55 -
 56
56 -
 57
57 -
 58
58 -
 59
59 -
 60
60 -
61
-
62
-
63
-
64
-
65
-
66
-
67
-
68
-
69
-
70
-
71
-
72
-
73
-
74
-
75
-
76
-
77
-
78
-
79
-
80
-
81
-
82
-
83
-
84
-
85
-
86
-
87
-
88
-
89
-
90
-
91
-
92
-
93
-
94
-
95
-
96
-
97
-
98
-
99
-
100
-
101
-
102
-
103
-
104
-
105
-
106
-
107
-
108
-
109
-
110
-
111
-
112
-
113
-
114
-
115
-
116
-
117
-
118
-
119
-
120
-
121
-
122
-
123
-
124
-
125
-
126
-
127
-
128
 |
 |

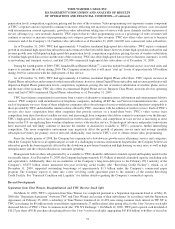
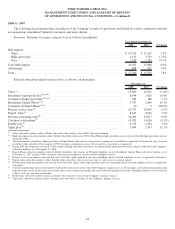
Subscription revenues increased as a result of increases in video, high-speed data and voice revenues. The increase in video revenues
was primarily due to an increase in revenues from digital video recorder service, video price increases and the continued growth of digital
video subscribers, which were partially offset by a decrease in video subscribers (resulting, in part, from the December 2008 sale of
certain non-core cable systems serving 78,000 video subscribers) and a decline in premium channel subscribers and transactional
video-on-demand revenues. Commercial video revenues were $252 million in 2009 compared to $239 million in 2008. Additional
information regarding the major components of video revenues was as follows (in millions):
2009 2008 % Change
Year Ended December 31,
Programming tiers
(a)
....................................................... $ 7,188 $ 7,095 1.3%
Premium channels ......................................................... 875 913 (4.2%)
Transactional video-on-demand ............................................... 367 399 (8.0%)
Video equipment rental and installation charges ................................... 1,195 1,112 7.5%
Digital video recorder service ................................................ 510 403 26.6%
Franchise fees ............................................................ 476 459 3.7%
Other .................................................................. 149 143 4.2%
Total ................................................................... $ 10,760 $ 10,524 2.2%
(a)
Programming tier revenues include subscriber fees for BST, CPST and DBT video programming, as well as genre-based programming tiers, such as movie, sports and
Spanish language tiers.
High-speed data revenues increased primarily due to growth in high-speed data subscribers and an increase in cell tower backhaul
and Metro Ethernet revenues. Commercial high-speed data revenues were $593 million in 2009 compared to $526 million in 2008.
The increase in voice revenues was due to growth in Digital Phone subscribers, partially offset by a decrease in average revenues per
subscriber. Commercial voice revenues were $70 million in 2009 compared to $28 million in 2008.
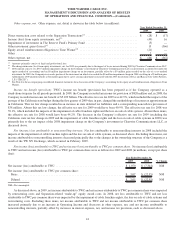
Average monthly subscription revenues (which includes video, high-speed data and voice revenues) per unit were as follows:
2009 2008 % Change
Year Ended December 31,
Average monthly subscription revenues per:
Customer relationship .................................................... $ 97.83 $ 92.44 5.8%
Primary service unit ...................................................... 54.85 54.27 1.1%
Advertising revenues decreased due to a decline in Advertising revenues from national, regional and local businesses and political
advertising revenues. The Company expects that Advertising revenues will increase in 2010 as compared to 2009 primarily due to an
increase in political advertising revenues, as well as an increase in Advertising revenues from national, regional and local businesses.
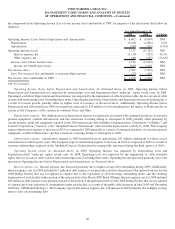
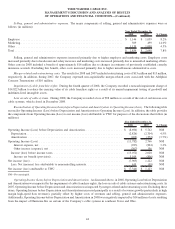
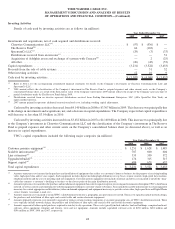
Costs of revenues. The major components of costs of revenues were as follows (in millions):
2009 2008 % Change
Year Ended December 31,
Video programming ........................................................ $ 3,998 $ 3,753 6.5%
Employee ............................................................... 2,594 2,511 3.3%
High-speed data........................................................... 132 146 (9.6%)
Voice .................................................................. 633 552 14.7%
Video franchise fees ....................................................... 476 459 3.7%
Other direct operating costs .................................................. 722 724 (0.3%)
Total ................................................................... $ 8,555 $ 8,145 5.0%
Costs of revenues as a percentage of revenues .................................... 47.9% 47.4%
Costs of revenues increased 5.0%, primarily related to increases in video programming, employee and voice costs.
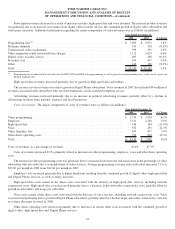
The increase in video programming costs was primarily due to contractual rate increases, incremental costs associated with the
continued retransmission of certain local broadcast stations and the expansion of service offerings, partially offset by a decline in video
and premium channel subscriptions. Average programming costs per video subscriber increased 8.5% to $25.60 per month in 2009 from
$23.60 per month in 2008.
38
TIME WARNER CABLE INC.
MANAGEMENT’S DISCUSSION AND ANALYSIS OF RESULTS
OF OPERATIONS AND FINANCIAL CONDITION—(Continued)