The Hartford 2012 Annual Report Download - page 88
Download and view the complete annual report
Please find page 88 of the 2012 The Hartford annual report below. You can navigate through the pages in the report by either clicking on the pages listed below, or by using the keyword search tool below to find specific information within the annual report.-
 1
1 -
2
-
3
-
4
-
5
-
6
-
7
-
8
-
9
-
10
-
11
-
12
-
13
-
14
-
15
-
16
-
17
-
18
-
19
-
20
-
21
-
22
-
23
-
24
-
25
-
26
-
27
-
28
-
29
-
30
-
31
-
32
-
33
-
34
-
35
-
36
-
37
-
38
-
39
-
40
-
41
-
42
-
43
-
44
-
45
-
46
-
47
-
48
-
49
-
50
-
51
-
52
-
53
-
54
-
55
-
56
-
57
-
58
-
59
-
60
-
61
-
62
-
63
-
64
-
65
-
66
-
67
-
68
-
69
-
70
-
71
-
72
-
73
-
74
-
75
-
76
-
77
-
 78
78 -
 79
79 -
 80
80 -
 81
81 -
 82
82 -
 83
83 -
 84
84 -
 85
85 -
 86
86 -
 87
87 -
 88
88 -
 89
89 -
 90
90 -
 91
91 -
 92
92 -
 93
93 -
 94
94 -
 95
95 -
 96
96 -
 97
97 -
 98
98 -
99
-
100
-
101
-
102
-
103
-
104
-
105
-
106
-
107
-
108
-
109
-
110
-
111
-
112
-
113
-
114
-
115
-
116
-
117
-
118
-
119
-
120
-
121
-
122
-
123
-
124
-
125
-
126
-
127
-
128
-
129
-
130
-
131
-
132
-
133
-
134
-
135
-
136
-
137
-
138
-
139
-
140
-
141
-
142
-
143
-
144
-
145
-
146
-
147
-
148
-
149
-
150
-
151
-
152
-
153
-
154
-
155
-
156
-
157
-
158
-
159
-
160
-
161
-
162
-
163
-
164
-
165
-
166
-
167
-
168
-
169
-
170
-
171
-
172
-
173
-
174
-
175
-
176
-
177
-
178
-
179
-
180
-
181
-
182
-
183
-
184
-
185
-
186
-
187
-
188
-
189
-
190
-
191
-
192
-
193
-
194
-
195
-
196
-
197
-
198
-
199
-
200
-
201
-
202
-
203
-
204
-
205
-
206
-
207
-
208
-
209
-
210
-
211
-
212
-
213
-
214
-
215
-
216
-
217
-
218
-
219
-
220
-
221
-
222
-
223
-
224
-
225
-
226
-
227
-
228
-
229
-
230
-
231
-
232
-
233
-
234
-
235
-
236
-
237
-
238
-
239
-
240
-
241
-
242
-
243
-
244
-
245
-
246
-
247
-
248
-
249
-
250
-
251
-
252
-
253
-
254
-
255
-
256
-
257
-
258
-
259
-
260
-
261
-
262
-
263
-
264
-
265
-
266
-
267
-
268
-
269
-
270
-
271
-
272
-
273
-
274
-
275
-
276
-
277
-
278
-
279
-
280
-
281
-
282
-
283
-
284
-
285
-
286
-
287
-
288
-
289
-
290
-
291
-
292
-
293
-
294
-
295
-
296
-
297
-
298
-
299
-
300
-
301
-
302
-
303
-
304
-
305
-
306
-
307
-
308
-
309
-
310
-
311
-
312
-
313
-
314
-
315
-
316
-
317
-
318
-
319
-
320
-
321
-
322
-
323
-
324
-
325
-
326
-
327
-
328
-
329
-
330
-
331
-
332
-
333
-
334
-
335
 |
 |

Table of Contents
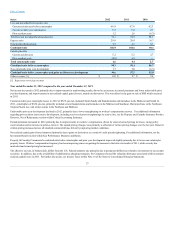
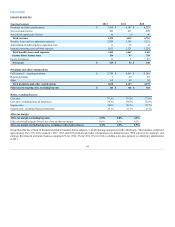
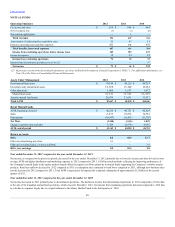
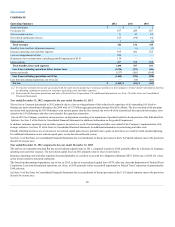
Earned premiums [1] $(10) $ 129 $137
Fee income and other [1] 3,604 3,830 3,843
Net investment income (loss)
Securities available-for-sale and other 2,572 2,593 2,577
Equity securities trading [2] 4,565 (1,359)(774)
Total net investment income 7,137 1,234 1,803
Net realized capital gains (losses) (972) 15 (750)
Benefits, losses and loss adjustment expenses 2,951 3,535 3,124
Benefits, losses and loss adjustment expenses — returns credited on international variable annuities
[2] 4,564 (1,359)(774)
Amortization of deferred policy acquisition costs 661 1,108 325
Insurance operating costs and other expenses 1,451 1,504 1,475
Reinsurance loss on disposition, including goodwill impairment of $224 415 — —
Income tax expense (benefit) (284)(120) 205
Loss from discontinued operations, net of tax [3] — (6)
Variable annuity account value $ 94,371 $ 99,922 $116,520
Fixed Market Value Adjusted annuity and other account value 14,755 16,417 16,819
Institutional annuity account value [4] 17,744 19,330 19,674
Other account value [5] 102,429 100,937 100,804
Net flows (13,594) (13,400)(11,977)
Change in market value and other 11,303 (4,831)6,429
Effect of currency translation (3,260) 1,633 4,036
[1] Includes earned premiums, fees and other related to the Retirement Plans business of $368, $380 and $359 and the Individual Life business of
$866, $899 and $856, for the years ended December 31, 2012, 2011 and 2010, respectively.
[2] Includes investment income and mark-to-market effects of equity securities, trading, supporting the international variable annuity business, which
are classified in net investment income with corresponding amounts credited to policyholders within benefits, losses and loss adjustment expenses.
[3] Represents loss from discontinued operations, net of tax, of Hartford Advantage Investment, Ltd. (“HAIL”). For additional information, see Note 20
of the Notes to Consolidated Financial Statements.
[4] Included in the balance is approximately $(1.2) billion, $(1.3) billion and $(1.4) billion at December 31, 2012, December 31, 2011 and December
31, 2010, respectively, related to an intra-segment funding agreement which is eliminated in consolidation.
[5] Other account value includes $37.4 billion, $13.2 billion and $51.8 billion, respectively, at December 31, 2012 for the Private Placement Life
Insurance, Individual Life and Retirement Plans businesses.
87