The Hartford 2012 Annual Report Download - page 181
Download and view the complete annual report
Please find page 181 of the 2012 The Hartford annual report below. You can navigate through the pages in the report by either clicking on the pages listed below, or by using the keyword search tool below to find specific information within the annual report.-
 1
1 -
2
-
3
-
4
-
5
-
6
-
7
-
8
-
9
-
10
-
11
-
12
-
13
-
14
-
15
-
16
-
17
-
18
-
19
-
20
-
21
-
22
-
23
-
24
-
25
-
26
-
27
-
28
-
29
-
30
-
31
-
32
-
33
-
34
-
35
-
36
-
37
-
38
-
39
-
40
-
41
-
42
-
43
-
44
-
45
-
46
-
47
-
48
-
49
-
50
-
51
-
52
-
53
-
54
-
55
-
56
-
57
-
58
-
59
-
60
-
61
-
62
-
63
-
64
-
65
-
66
-
67
-
68
-
69
-
70
-
71
-
72
-
73
-
74
-
75
-
76
-
77
-
78
-
79
-
80
-
81
-
82
-
83
-
84
-
85
-
86
-
87
-
88
-
89
-
90
-
91
-
92
-
93
-
94
-
95
-
96
-
97
-
98
-
99
-
100
-
101
-
102
-
103
-
104
-
105
-
106
-
107
-
108
-
109
-
110
-
111
-
112
-
113
-
114
-
115
-
116
-
117
-
118
-
119
-
120
-
121
-
122
-
123
-
124
-
125
-
126
-
127
-
128
-
129
-
130
-
131
-
132
-
133
-
134
-
135
-
136
-
137
-
138
-
139
-
140
-
141
-
142
-
143
-
144
-
145
-
146
-
147
-
148
-
149
-
150
-
151
-
152
-
153
-
154
-
155
-
156
-
157
-
158
-
159
-
160
-
161
-
162
-
163
-
164
-
165
-
166
-
167
-
168
-
169
-
170
-
 171
171 -
 172
172 -
 173
173 -
 174
174 -
 175
175 -
 176
176 -
 177
177 -
 178
178 -
 179
179 -
 180
180 -
 181
181 -
 182
182 -
 183
183 -
 184
184 -
 185
185 -
 186
186 -
 187
187 -
 188
188 -
 189
189 -
 190
190 -
 191
191 -
192
-
193
-
194
-
195
-
196
-
197
-
198
-
199
-
200
-
201
-
202
-
203
-
204
-
205
-
206
-
207
-
208
-
209
-
210
-
211
-
212
-
213
-
214
-
215
-
216
-
217
-
218
-
219
-
220
-
221
-
222
-
223
-
224
-
225
-
226
-
227
-
228
-
229
-
230
-
231
-
232
-
233
-
234
-
235
-
236
-
237
-
238
-
239
-
240
-
241
-
242
-
243
-
244
-
245
-
246
-
247
-
248
-
249
-
250
-
251
-
252
-
253
-
254
-
255
-
256
-
257
-
258
-
259
-
260
-
261
-
262
-
263
-
264
-
265
-
266
-
267
-
268
-
269
-
270
-
271
-
272
-
273
-
274
-
275
-
276
-
277
-
278
-
279
-
280
-
281
-
282
-
283
-
284
-
285
-
286
-
287
-
288
-
289
-
290
-
291
-
292
-
293
-
294
-
295
-
296
-
297
-
298
-
299
-
300
-
301
-
302
-
303
-
304
-
305
-
306
-
307
-
308
-
309
-
310
-
311
-
312
-
313
-
314
-
315
-
316
-
317
-
318
-
319
-
320
-
321
-
322
-
323
-
324
-
325
-
326
-
327
-
328
-
329
-
330
-
331
-
332
-
333
-
334
-
335
 |
 |
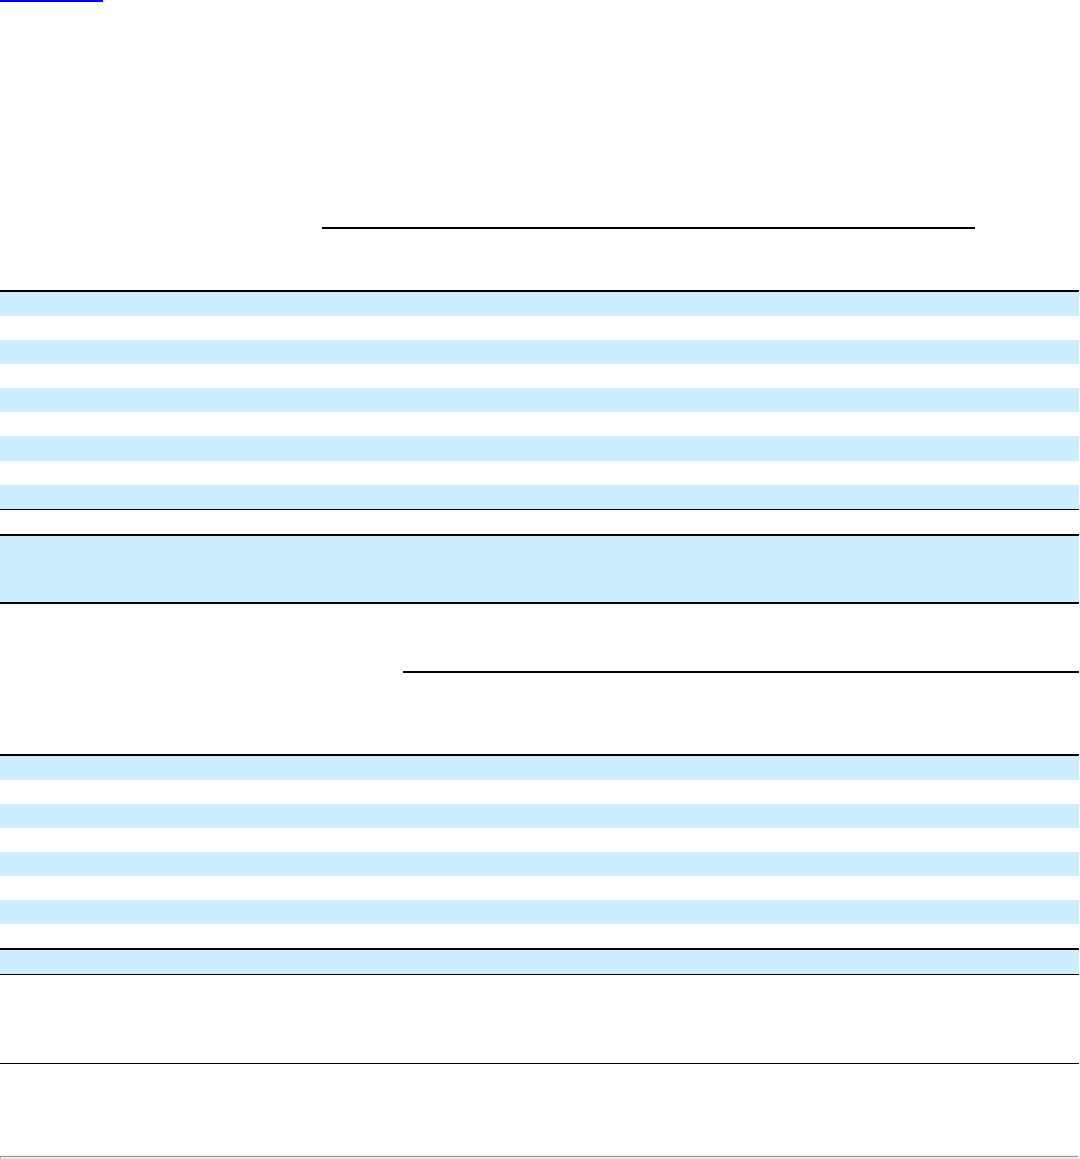
Table of Contents
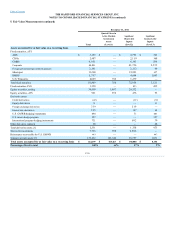
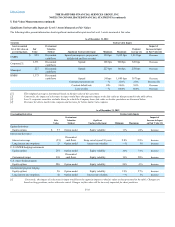
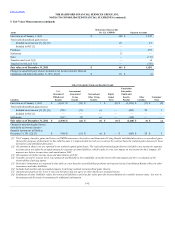
Assets and Liabilities Measured at Fair Value on a Recurring Basis Using Significant Unobservable Inputs (Level 3)
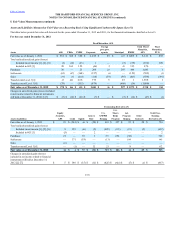
The tables below provide fair value roll-forwards for the years ended December 31, 2012 and 2011, for the financial instruments classified as Level 3.
Fair value as of January 1, 2012 $ 361 $ 368 $ 588 $2,255 $ 49 $ 437 $ 1,063 $ 5,121 $495
Total realized/unrealized gains (losses)
Included in net income [1], [2], [6] (2)(20)(83)3— (5) (55) (162) 109
Included in OCI [3] 49 163 152 (46) 2 41 315 676 —
Purchases 36 — 21 264 23 293 446 1,083 1
Settlements (63)(47)(160) (157) (4) — (151) (582) (1)
Sales (37)(3)(210)(114) (19) (96)(207)(686)(391)
Transfers into Level 3 [4] 13 483 666 775 525 11,968 1
Transfers out of Level 3 [4] (79) — (115)(979) — (468)(39) (1,680) —
Changes in unrealized gains (losses) included
in net income related to financial instruments
still held at December 31, 2012 [2] [7] $ (5) $ (12) $ (46) $ (7) $ — $ (5) $ (12) $ (87) $ (4)
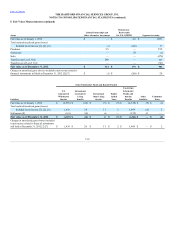
Fair value as of January 1, 2012 $ 93 $ (561) $ 40 $ (58) $ 883 $ 357 $ 35 $ 28 $ 724
Total realized/unrealized gains (losses)
Included in net income [1], [2], [6] 8195 (40) (9) (429)(323)(21) (5) (632)
Included in OCI [3] (5) — — 2 — — — — 2
Purchases 21 — 76 155 252 (58) — 326
Settlements —371 (19) — (13) — 104 —443
Sales (33) — — — — — — — —
Transfers out of Level 3 [4] —(1) — 32 23 — 8 — 62
Changes in unrealized gains (losses)
included in net income related to financial
instruments still held at December 31,
2012 [2] [7] $ 5 $ 146 $ (15) $ (12) $ (425) $ (322) $ (5) $ (4) $ (637)
F-39