The Hartford 2012 Annual Report Download - page 84
Download and view the complete annual report
Please find page 84 of the 2012 The Hartford annual report below. You can navigate through the pages in the report by either clicking on the pages listed below, or by using the keyword search tool below to find specific information within the annual report.-
 1
1 -
2
-
3
-
4
-
5
-
6
-
7
-
8
-
9
-
10
-
11
-
12
-
13
-
14
-
15
-
16
-
17
-
18
-
19
-
20
-
21
-
22
-
23
-
24
-
25
-
26
-
27
-
28
-
29
-
30
-
31
-
32
-
33
-
34
-
35
-
36
-
37
-
38
-
39
-
40
-
41
-
42
-
43
-
44
-
45
-
46
-
47
-
48
-
49
-
50
-
51
-
52
-
53
-
54
-
55
-
56
-
57
-
58
-
59
-
60
-
61
-
62
-
63
-
64
-
65
-
66
-
67
-
68
-
69
-
70
-
71
-
72
-
73
-
 74
74 -
 75
75 -
 76
76 -
 77
77 -
 78
78 -
 79
79 -
 80
80 -
 81
81 -
 82
82 -
 83
83 -
 84
84 -
 85
85 -
 86
86 -
 87
87 -
 88
88 -
 89
89 -
 90
90 -
 91
91 -
 92
92 -
 93
93 -
 94
94 -
95
-
96
-
97
-
98
-
99
-
100
-
101
-
102
-
103
-
104
-
105
-
106
-
107
-
108
-
109
-
110
-
111
-
112
-
113
-
114
-
115
-
116
-
117
-
118
-
119
-
120
-
121
-
122
-
123
-
124
-
125
-
126
-
127
-
128
-
129
-
130
-
131
-
132
-
133
-
134
-
135
-
136
-
137
-
138
-
139
-
140
-
141
-
142
-
143
-
144
-
145
-
146
-
147
-
148
-
149
-
150
-
151
-
152
-
153
-
154
-
155
-
156
-
157
-
158
-
159
-
160
-
161
-
162
-
163
-
164
-
165
-
166
-
167
-
168
-
169
-
170
-
171
-
172
-
173
-
174
-
175
-
176
-
177
-
178
-
179
-
180
-
181
-
182
-
183
-
184
-
185
-
186
-
187
-
188
-
189
-
190
-
191
-
192
-
193
-
194
-
195
-
196
-
197
-
198
-
199
-
200
-
201
-
202
-
203
-
204
-
205
-
206
-
207
-
208
-
209
-
210
-
211
-
212
-
213
-
214
-
215
-
216
-
217
-
218
-
219
-
220
-
221
-
222
-
223
-
224
-
225
-
226
-
227
-
228
-
229
-
230
-
231
-
232
-
233
-
234
-
235
-
236
-
237
-
238
-
239
-
240
-
241
-
242
-
243
-
244
-
245
-
246
-
247
-
248
-
249
-
250
-
251
-
252
-
253
-
254
-
255
-
256
-
257
-
258
-
259
-
260
-
261
-
262
-
263
-
264
-
265
-
266
-
267
-
268
-
269
-
270
-
271
-
272
-
273
-
274
-
275
-
276
-
277
-
278
-
279
-
280
-
281
-
282
-
283
-
284
-
285
-
286
-
287
-
288
-
289
-
290
-
291
-
292
-
293
-
294
-
295
-
296
-
297
-
298
-
299
-
300
-
301
-
302
-
303
-
304
-
305
-
306
-
307
-
308
-
309
-
310
-
311
-
312
-
313
-
314
-
315
-
316
-
317
-
318
-
319
-
320
-
321
-
322
-
323
-
324
-
325
-
326
-
327
-
328
-
329
-
330
-
331
-
332
-
333
-
334
-
335
 |
 |

Table of Contents
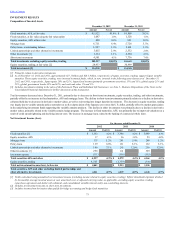
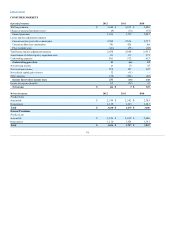
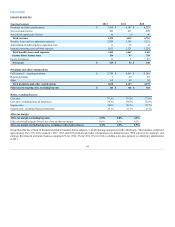
Written premiums $ 8 $ 1 $ 2
Change in unearned premium reserve 10 1 1
Earned premiums (2) — 1
Losses and loss adjustment expenses
Prior accident years 65 317 251
Total losses and loss adjustment expenses 65 317 251
Underwriting expenses 33 27 26
Net investment income 149 151 163
Net realized capital gains (losses) 17 (1)24
Other income (expense) 53(4)
Income tax expense (benefit) 14 (74)(40)
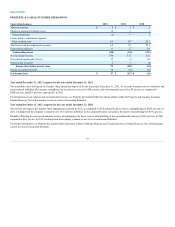
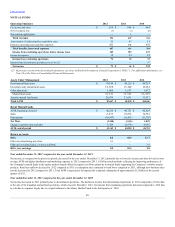
Year ended December 31, 2012 compared to the year ended December 31, 2011
The net income (loss) in Property & Casualty Other Operations improved for the year ended December 31, 2012. As a result of annual reviews of asbestos and
environmental liabilities, the company strengthened its net asbestos reserves by $48, pre-tax, and environmental reserves by $3, pre-tax, as compared to
$290, pre-tax, and $19, pre-tax, respectively, in 2011.
For information on net asbestos and environmental reserves, see Property & Casualty Other Operations Claims within the Property and Casualty Insurance
Product Reserves, Net of Reinsurance section in Critical Accounting Estimates.
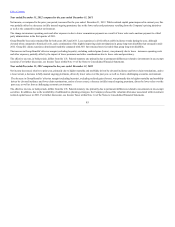
Year ended December 31, 2011 compared to the year ended December 31, 2010
The net loss in Property & Casualty Other Operations increased in 2011, as compared to 2010, primarily due to reserve strengthening of $290, pre-tax, in
2011, resulting from the company’s annual review of its asbestos liabilities. In the comparable prior year period, the reserve strengthening was $169, pre-tax.
Partially offsetting the increase in asbestos reserve strengthening was lower reserve strengthening of net environmental reserves of $19, pre-tax, in 2011
compared to $62, pre-tax, in 2010, resulting from the company’s annual review of its environmental liabilities.
For further information, see Property & Casualty Other Operations Claims within the Property and Casualty Insurance Product Reserves, Net of Reinsurance
section in Critical Accounting Estimates.
83