The Hartford 2012 Annual Report Download - page 241
Download and view the complete annual report
Please find page 241 of the 2012 The Hartford annual report below. You can navigate through the pages in the report by either clicking on the pages listed below, or by using the keyword search tool below to find specific information within the annual report.-
 1
1 -
2
-
3
-
4
-
5
-
6
-
7
-
8
-
9
-
10
-
11
-
12
-
13
-
14
-
15
-
16
-
17
-
18
-
19
-
20
-
21
-
22
-
23
-
24
-
25
-
26
-
27
-
28
-
29
-
30
-
31
-
32
-
33
-
34
-
35
-
36
-
37
-
38
-
39
-
40
-
41
-
42
-
43
-
44
-
45
-
46
-
47
-
48
-
49
-
50
-
51
-
52
-
53
-
54
-
55
-
56
-
57
-
58
-
59
-
60
-
61
-
62
-
63
-
64
-
65
-
66
-
67
-
68
-
69
-
70
-
71
-
72
-
73
-
74
-
75
-
76
-
77
-
78
-
79
-
80
-
81
-
82
-
83
-
84
-
85
-
86
-
87
-
88
-
89
-
90
-
91
-
92
-
93
-
94
-
95
-
96
-
97
-
98
-
99
-
100
-
101
-
102
-
103
-
104
-
105
-
106
-
107
-
108
-
109
-
110
-
111
-
112
-
113
-
114
-
115
-
116
-
117
-
118
-
119
-
120
-
121
-
122
-
123
-
124
-
125
-
126
-
127
-
128
-
129
-
130
-
131
-
132
-
133
-
134
-
135
-
136
-
137
-
138
-
139
-
140
-
141
-
142
-
143
-
144
-
145
-
146
-
147
-
148
-
149
-
150
-
151
-
152
-
153
-
154
-
155
-
156
-
157
-
158
-
159
-
160
-
161
-
162
-
163
-
164
-
165
-
166
-
167
-
168
-
169
-
170
-
171
-
172
-
173
-
174
-
175
-
176
-
177
-
178
-
179
-
180
-
181
-
182
-
183
-
184
-
185
-
186
-
187
-
188
-
189
-
190
-
191
-
192
-
193
-
194
-
195
-
196
-
197
-
198
-
199
-
200
-
201
-
202
-
203
-
204
-
205
-
206
-
207
-
208
-
209
-
210
-
211
-
212
-
213
-
214
-
215
-
216
-
217
-
218
-
219
-
220
-
221
-
222
-
223
-
224
-
225
-
226
-
227
-
228
-
229
-
230
-
 231
231 -
 232
232 -
 233
233 -
 234
234 -
 235
235 -
 236
236 -
 237
237 -
 238
238 -
 239
239 -
 240
240 -
 241
241 -
 242
242 -
 243
243 -
 244
244 -
 245
245 -
 246
246 -
 247
247 -
 248
248 -
 249
249 -
 250
250 -
 251
251 -
252
-
253
-
254
-
255
-
256
-
257
-
258
-
259
-
260
-
261
-
262
-
263
-
264
-
265
-
266
-
267
-
268
-
269
-
270
-
271
-
272
-
273
-
274
-
275
-
276
-
277
-
278
-
279
-
280
-
281
-
282
-
283
-
284
-
285
-
286
-
287
-
288
-
289
-
290
-
291
-
292
-
293
-
294
-
295
-
296
-
297
-
298
-
299
-
300
-
301
-
302
-
303
-
304
-
305
-
306
-
307
-
308
-
309
-
310
-
311
-
312
-
313
-
314
-
315
-
316
-
317
-
318
-
319
-
320
-
321
-
322
-
323
-
324
-
325
-
326
-
327
-
328
-
329
-
330
-
331
-
332
-
333
-
334
-
335
 |
 |
Table of Contents
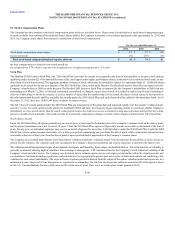
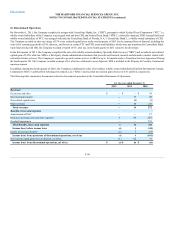
On November 1, 2011, the Company completed a merger with CenterState Banks, Inc. (“CBI”), pursuant to which Federal Trust Corporation (“FTC”), a
wholly owned subsidiary of the Company, was merged with and into CBI, and Federal Trust Bank (“FTB”), a federally chartered, FDIC-insured thrift and
wholly owned subsidiary of FTC, was merged with and into CenterState Bank of Florida, N.A. (“CenterState Bank”), a wholly owned subsidiary of CBI.
The Company recorded an after-tax charge of $74 to net realized capital losses in the second quarter of 2011 for the estimated loss on disposal, including the
write off of remaining goodwill of $10, after-tax, and losses on certain FTC and FTB assets and liabilities, which were not transferred to CenterState Bank.
Upon final closing with CBI, the Company recorded a benefit of $ 6, after tax, in the fourth quarter of 2011 related to the divestiture.
In the first quarter of 2011, the Company completed the sale of its wholly-owned subsidiary Specialty Risk Services (“SRS”) and recorded a net realized
capital gain of $150, after-tax. SRS is a third-party claims administration business that provides self-insured, insured, and alternative market clients with
customized claims services. The Company is required to provide certain services to SRS for up to 24 months under a Transition Services Agreement. During
the fourth quarter 2011 the Company recorded a charge of $ 4, after-tax, attributed to asset disposals. SRS is included in the Property & Casualty Commercial
reporting segment.
In addition, during the fourth quarter of 2010, the Company completed the sales of its indirect wholly-owned subsidiaries Hartford Investments Canada
Corporation (“HICC”) and Hartford Advantage Investment, Ltd. (“HAIL”) and recorded net realized gains (losses) of $ 41 and $(4), respectively.
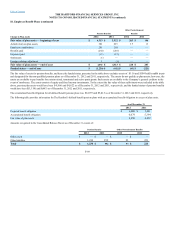
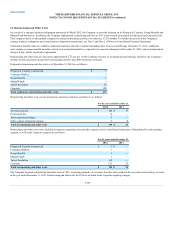
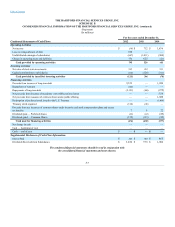
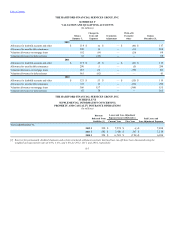
The following table summarizes the amounts related to discontinued operations in the Consolidated Statements of Operations.
Revenues
Fee income and other $ — $ — $ 36
Net investment income — 17 28
Net realized capital losses — (6) (5)
Other revenues —48 213
Benefits, losses and expenses
Amortization of DAC — — 17
Insurance operating costs and other expenses 6 54 256
Goodwill impairment — — 153
Income tax expense (benefit) (2) 1 (53)
Net realized capital gain (loss) on disposal, net of tax (1) 82 37
F-99