The Hartford 2012 Annual Report Download - page 162
Download and view the complete annual report
Please find page 162 of the 2012 The Hartford annual report below. You can navigate through the pages in the report by either clicking on the pages listed below, or by using the keyword search tool below to find specific information within the annual report.-
 1
1 -
2
-
3
-
4
-
5
-
6
-
7
-
8
-
9
-
10
-
11
-
12
-
13
-
14
-
15
-
16
-
17
-
18
-
19
-
20
-
21
-
22
-
23
-
24
-
25
-
26
-
27
-
28
-
29
-
30
-
31
-
32
-
33
-
34
-
35
-
36
-
37
-
38
-
39
-
40
-
41
-
42
-
43
-
44
-
45
-
46
-
47
-
48
-
49
-
50
-
51
-
52
-
53
-
54
-
55
-
56
-
57
-
58
-
59
-
60
-
61
-
62
-
63
-
64
-
65
-
66
-
67
-
68
-
69
-
70
-
71
-
72
-
73
-
74
-
75
-
76
-
77
-
78
-
79
-
80
-
81
-
82
-
83
-
84
-
85
-
86
-
87
-
88
-
89
-
90
-
91
-
92
-
93
-
94
-
95
-
96
-
97
-
98
-
99
-
100
-
101
-
102
-
103
-
104
-
105
-
106
-
107
-
108
-
109
-
110
-
111
-
112
-
113
-
114
-
115
-
116
-
117
-
118
-
119
-
120
-
121
-
122
-
123
-
124
-
125
-
126
-
127
-
128
-
129
-
130
-
131
-
132
-
133
-
134
-
135
-
136
-
137
-
138
-
139
-
140
-
141
-
142
-
143
-
144
-
145
-
146
-
147
-
148
-
149
-
150
-
151
-
 152
152 -
 153
153 -
 154
154 -
 155
155 -
 156
156 -
 157
157 -
 158
158 -
 159
159 -
 160
160 -
 161
161 -
 162
162 -
 163
163 -
 164
164 -
 165
165 -
 166
166 -
 167
167 -
 168
168 -
 169
169 -
 170
170 -
 171
171 -
 172
172 -
173
-
174
-
175
-
176
-
177
-
178
-
179
-
180
-
181
-
182
-
183
-
184
-
185
-
186
-
187
-
188
-
189
-
190
-
191
-
192
-
193
-
194
-
195
-
196
-
197
-
198
-
199
-
200
-
201
-
202
-
203
-
204
-
205
-
206
-
207
-
208
-
209
-
210
-
211
-
212
-
213
-
214
-
215
-
216
-
217
-
218
-
219
-
220
-
221
-
222
-
223
-
224
-
225
-
226
-
227
-
228
-
229
-
230
-
231
-
232
-
233
-
234
-
235
-
236
-
237
-
238
-
239
-
240
-
241
-
242
-
243
-
244
-
245
-
246
-
247
-
248
-
249
-
250
-
251
-
252
-
253
-
254
-
255
-
256
-
257
-
258
-
259
-
260
-
261
-
262
-
263
-
264
-
265
-
266
-
267
-
268
-
269
-
270
-
271
-
272
-
273
-
274
-
275
-
276
-
277
-
278
-
279
-
280
-
281
-
282
-
283
-
284
-
285
-
286
-
287
-
288
-
289
-
290
-
291
-
292
-
293
-
294
-
295
-
296
-
297
-
298
-
299
-
300
-
301
-
302
-
303
-
304
-
305
-
306
-
307
-
308
-
309
-
310
-
311
-
312
-
313
-
314
-
315
-
316
-
317
-
318
-
319
-
320
-
321
-
322
-
323
-
324
-
325
-
326
-
327
-
328
-
329
-
330
-
331
-
332
-
333
-
334
-
335
 |
 |

Table of Contents
On January 1, 2013, the Company completed the sale of its Retirement Plans business to MassMutual for a ceding commission of $355. The sale was
structured as a reinsurance transaction and is estimated to break-even on a pre tax basis and result in an after tax loss consisting of a reinsurance loss,
partially offset by realized capital gains. The estimated after tax loss is primarily driven by non-deductible goodwill. Upon closing, the Company reinsured
$9.2 billion of policyholder liabilities and $26.3 billion of separate account liabilities under indemnity reinsurance arrangements. The Company also
transferred invested assets with a carrying value of $9.3 billion, net of the ceding commission, to MassMutual and wrote off $200 of deferred acquisition
costs, deferred income taxes, goodwill, property and equipment and other assets associated with the disposition. These amounts are subject to change pending
final determination of the net assets sold, transaction costs and other adjustments. The Retirement Plans business is included in the Talcott Resolution
reporting segment.
On January 2, 2013 the Company completed the sale of its Individual Life insurance business to Prudential for consideration of $615 consisting primarily of
a ceding commission. The sale was structured as a reinsurance transaction and is estimated to result in a loss on business disposition consisting of a
reinsurance loss partially offset by realized capital gains. Upon closing, in the first quarter of 2013 the Company reinsured $8.7 billion of policyholder
liabilities and $5.3 billion of separate account liabilities under indemnity reinsurance arrangements. The Company also transferred invested assets with a
carrying value of $8.0 billion, exclusive of $1.4 billion of assets supporting the modified coinsurance agreement, net of cash transferred in place of short-term
investments, to Prudential and wrote off $1.8 billion of deferred acquisition costs, deferred income taxes, property and equipment and other assets and $1.5
billion of other liabilities associated with the disposition.
The estimated reinsurance loss on business disposition of $533, pre tax, for the year ended December 31, 2012 includes a goodwill impairment charge of
$342 and a loss accrual for premium deficiency of $191. This estimate reflects management's best estimate of the potential loss from this transaction. The
loss accrual is included in other liabilities in the Company's Consolidated Balance Sheets at December 31, 2012. For further information regarding the
Company's 2012 goodwill impairment testing, see Note 9 - Goodwill and Other Intangible Assets. These amounts are subject to change pending final
determination of the net assets sold, transaction costs and other adjustments. The Individual Life business is included in the Talcott Resolution reporting
segment.
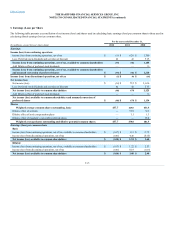
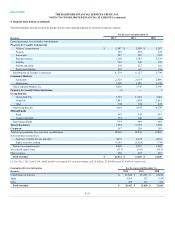
The following table presents invested assets transferred by the Company in connection with the sale of the Retirement Plans and Individual Life businesses in
January 2013. In December 2012, the Company recognized intent-to-sell impairments of $177 and gains on derivatives hedging of $108 associated with the
sale of these assets.
Asset-backed securities ("ABS") $289
Collaterialized debt obligations ("CDOs") [1] 474
Commercial mortgage-backed securities ("CMBS") 949
Corporate 11,651
Foreign govt./govt. agencies 263
Municipal 900
Residential mortgage-backed securities ("RMBS") 707
U.S. Treasuries 116
Equity securities, AFS, at fair value (cost of $35) [3] 37
Fixed maturities, at fair value using the FVO [4] 16
Mortgage loans (net of allowances for loan losses of $1) 1,364
Policy loans, at outstanding balance 582
F-21