The Hartford 2012 Annual Report Download - page 237
Download and view the complete annual report
Please find page 237 of the 2012 The Hartford annual report below. You can navigate through the pages in the report by either clicking on the pages listed below, or by using the keyword search tool below to find specific information within the annual report.-
 1
1 -
2
-
3
-
4
-
5
-
6
-
7
-
8
-
9
-
10
-
11
-
12
-
13
-
14
-
15
-
16
-
17
-
18
-
19
-
20
-
21
-
22
-
23
-
24
-
25
-
26
-
27
-
28
-
29
-
30
-
31
-
32
-
33
-
34
-
35
-
36
-
37
-
38
-
39
-
40
-
41
-
42
-
43
-
44
-
45
-
46
-
47
-
48
-
49
-
50
-
51
-
52
-
53
-
54
-
55
-
56
-
57
-
58
-
59
-
60
-
61
-
62
-
63
-
64
-
65
-
66
-
67
-
68
-
69
-
70
-
71
-
72
-
73
-
74
-
75
-
76
-
77
-
78
-
79
-
80
-
81
-
82
-
83
-
84
-
85
-
86
-
87
-
88
-
89
-
90
-
91
-
92
-
93
-
94
-
95
-
96
-
97
-
98
-
99
-
100
-
101
-
102
-
103
-
104
-
105
-
106
-
107
-
108
-
109
-
110
-
111
-
112
-
113
-
114
-
115
-
116
-
117
-
118
-
119
-
120
-
121
-
122
-
123
-
124
-
125
-
126
-
127
-
128
-
129
-
130
-
131
-
132
-
133
-
134
-
135
-
136
-
137
-
138
-
139
-
140
-
141
-
142
-
143
-
144
-
145
-
146
-
147
-
148
-
149
-
150
-
151
-
152
-
153
-
154
-
155
-
156
-
157
-
158
-
159
-
160
-
161
-
162
-
163
-
164
-
165
-
166
-
167
-
168
-
169
-
170
-
171
-
172
-
173
-
174
-
175
-
176
-
177
-
178
-
179
-
180
-
181
-
182
-
183
-
184
-
185
-
186
-
187
-
188
-
189
-
190
-
191
-
192
-
193
-
194
-
195
-
196
-
197
-
198
-
199
-
200
-
201
-
202
-
203
-
204
-
205
-
206
-
207
-
208
-
209
-
210
-
211
-
212
-
213
-
214
-
215
-
216
-
217
-
218
-
219
-
220
-
221
-
222
-
223
-
224
-
225
-
226
-
 227
227 -
 228
228 -
 229
229 -
 230
230 -
 231
231 -
 232
232 -
 233
233 -
 234
234 -
 235
235 -
 236
236 -
 237
237 -
 238
238 -
 239
239 -
 240
240 -
 241
241 -
 242
242 -
 243
243 -
 244
244 -
 245
245 -
 246
246 -
 247
247 -
248
-
249
-
250
-
251
-
252
-
253
-
254
-
255
-
256
-
257
-
258
-
259
-
260
-
261
-
262
-
263
-
264
-
265
-
266
-
267
-
268
-
269
-
270
-
271
-
272
-
273
-
274
-
275
-
276
-
277
-
278
-
279
-
280
-
281
-
282
-
283
-
284
-
285
-
286
-
287
-
288
-
289
-
290
-
291
-
292
-
293
-
294
-
295
-
296
-
297
-
298
-
299
-
300
-
301
-
302
-
303
-
304
-
305
-
306
-
307
-
308
-
309
-
310
-
311
-
312
-
313
-
314
-
315
-
316
-
317
-
318
-
319
-
320
-
321
-
322
-
323
-
324
-
325
-
326
-
327
-
328
-
329
-
330
-
331
-
332
-
333
-
334
-
335
 |
 |
Table of Contents
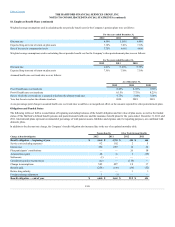
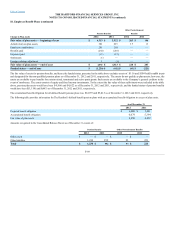
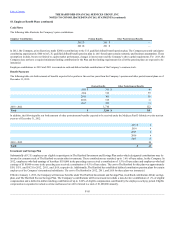
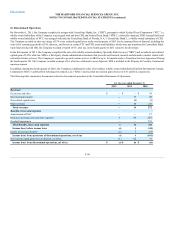
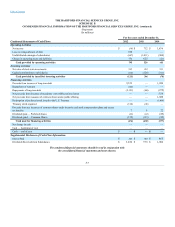
The following table illustrates the Company’s prior contributions.
2012 $201 $ —
2011 $201 $ —
In 2012, the Company, at its discretion, made $200 in contributions to the U.S. qualified defined benefit pension plan. The Company presently anticipates
contributing approximately $100 to its U.S. qualified defined benefit pension plan in 2013 based upon certain economic and business assumptions. These
assumptions include, but are not limited to, equity market performance, changes in interest rates and the Company’s other capital requirements. For 2013, the
Company does not have a required minimum funding contribution for the Plan and the funding requirements for all of the pension plans are expected to be
immaterial.
Employer contributions in 2012 and 2011 were made in cash and did not include contributions of the Company’s common stock.
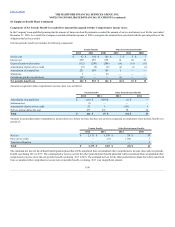
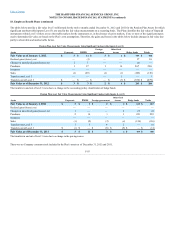
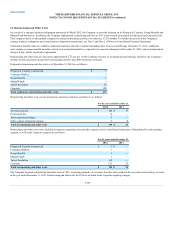
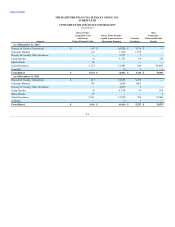
The following table sets forth amounts of benefits expected to be paid over the next ten years from the Company’s pension and other postretirement plans as of
December 31, 2012:
2013 $301 $40
2014 316 39
2015 305 36
2016 315 33
2017 322 31
2018 - 2022 1,710 122
In addition, the following table sets forth amounts of other postretirement benefits expected to be received under the Medicare Part D Subsidy over the next ten
years as of December 31, 2012:
2013 $4
2014 4
2015 4
2016 4
2017 5
2018 - 2022 24
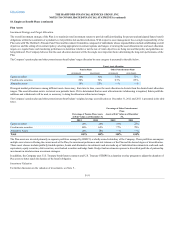
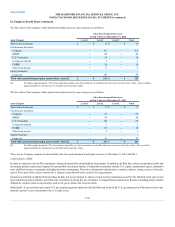
Substantially all U.S. employees are eligible to participate in The Hartford Investment and Savings Plan under which designated contributions may be
invested in common stock of The Hartford or certain other investments. These contributions are matched, up to 3.0% of base salary, by the Company. In
2012, employees who had earnings of less than $110,000 in the preceding year received a contribution of 1.5% of base salary and employees who had
earnings of $110,000 or more in the preceding year received a contribution of 0.5% of base salary. The cost to The Hartford for this plan was approximately
$58, $59, and $62 for 2012, 2011, and 2010, respectively. Additionally, The Hartford has established defined contribution pension plans for certain
employees of the Company’s international subsidiaries. The cost to The Hartford in 2012, 2011, and 2010 for these plans was immaterial.
Effective January 1, 2013, the Company will increase benefits under The Hartford Investment and Savings Plan, its defined contribution 401(k) savings
plan, and The Hartford Excess Savings Plan. The Company's contributions will be increased to include a non-elective contribution of 2% of eligible
compensation and a dollar-for-dollar matching contribution of up to 6.00% of eligible compensation contributed by the employee each pay period. Eligible
compensation is expanded to include overtime and bonuses but will be limited to a total of $1,000,000 annually.
F-95