The Hartford 2012 Annual Report Download - page 34
Download and view the complete annual report
Please find page 34 of the 2012 The Hartford annual report below. You can navigate through the pages in the report by either clicking on the pages listed below, or by using the keyword search tool below to find specific information within the annual report.-
 1
1 -
2
-
3
-
4
-
5
-
6
-
7
-
8
-
9
-
10
-
11
-
12
-
13
-
14
-
15
-
16
-
17
-
18
-
19
-
20
-
21
-
22
-
23
-
 24
24 -
 25
25 -
 26
26 -
 27
27 -
 28
28 -
 29
29 -
 30
30 -
 31
31 -
 32
32 -
 33
33 -
 34
34 -
 35
35 -
 36
36 -
 37
37 -
 38
38 -
 39
39 -
 40
40 -
 41
41 -
 42
42 -
 43
43 -
 44
44 -
45
-
46
-
47
-
48
-
49
-
50
-
51
-
52
-
53
-
54
-
55
-
56
-
57
-
58
-
59
-
60
-
61
-
62
-
63
-
64
-
65
-
66
-
67
-
68
-
69
-
70
-
71
-
72
-
73
-
74
-
75
-
76
-
77
-
78
-
79
-
80
-
81
-
82
-
83
-
84
-
85
-
86
-
87
-
88
-
89
-
90
-
91
-
92
-
93
-
94
-
95
-
96
-
97
-
98
-
99
-
100
-
101
-
102
-
103
-
104
-
105
-
106
-
107
-
108
-
109
-
110
-
111
-
112
-
113
-
114
-
115
-
116
-
117
-
118
-
119
-
120
-
121
-
122
-
123
-
124
-
125
-
126
-
127
-
128
-
129
-
130
-
131
-
132
-
133
-
134
-
135
-
136
-
137
-
138
-
139
-
140
-
141
-
142
-
143
-
144
-
145
-
146
-
147
-
148
-
149
-
150
-
151
-
152
-
153
-
154
-
155
-
156
-
157
-
158
-
159
-
160
-
161
-
162
-
163
-
164
-
165
-
166
-
167
-
168
-
169
-
170
-
171
-
172
-
173
-
174
-
175
-
176
-
177
-
178
-
179
-
180
-
181
-
182
-
183
-
184
-
185
-
186
-
187
-
188
-
189
-
190
-
191
-
192
-
193
-
194
-
195
-
196
-
197
-
198
-
199
-
200
-
201
-
202
-
203
-
204
-
205
-
206
-
207
-
208
-
209
-
210
-
211
-
212
-
213
-
214
-
215
-
216
-
217
-
218
-
219
-
220
-
221
-
222
-
223
-
224
-
225
-
226
-
227
-
228
-
229
-
230
-
231
-
232
-
233
-
234
-
235
-
236
-
237
-
238
-
239
-
240
-
241
-
242
-
243
-
244
-
245
-
246
-
247
-
248
-
249
-
250
-
251
-
252
-
253
-
254
-
255
-
256
-
257
-
258
-
259
-
260
-
261
-
262
-
263
-
264
-
265
-
266
-
267
-
268
-
269
-
270
-
271
-
272
-
273
-
274
-
275
-
276
-
277
-
278
-
279
-
280
-
281
-
282
-
283
-
284
-
285
-
286
-
287
-
288
-
289
-
290
-
291
-
292
-
293
-
294
-
295
-
296
-
297
-
298
-
299
-
300
-
301
-
302
-
303
-
304
-
305
-
306
-
307
-
308
-
309
-
310
-
311
-
312
-
313
-
314
-
315
-
316
-
317
-
318
-
319
-
320
-
321
-
322
-
323
-
324
-
325
-
326
-
327
-
328
-
329
-
330
-
331
-
332
-
333
-
334
-
335
 |
 |

Table of Contents
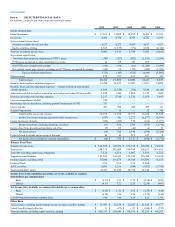
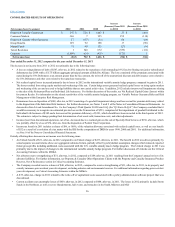
(In millions, except for per share data and combined ratios)
Earned premiums $ 13,631 $ 14,088 $14,055 $14,424 $15,503
Fee income 4,432 4,750 4,748 4,547 5,103
Net investment income (loss):
Securities available-for-sale and other 4,237 4,272 4,364 4,017 4,327
Equity securities, trading 4,565 (1,359)(774) 3,188 (10,340)
Total net investment income (loss) 8,802 2,913 3,590 7,205 (6,013)
Net realized capital losses:
Total other-than-temporary impairment (“OTTI”) losses (389)(263) (852) (2,191) (3,964)
OTTI losses recognized in other comprehensive income 40 89 418 683 —
Net OTTI losses recognized in earnings (349)(174)(434) (1,508) (3,964)
Net realized capital gains (losses), excluding net OTTI losses recognized in earnings (362)29 (177) (496) (1,941)
Total net realized capital losses (711)(145)(611)(2,004)(5,905)
Other revenues 258 253 267 261 249
Total revenues 26,412 21,859 22,049 24,433 8,937
Benefits, losses and loss adjustment expenses 13,250 14,625 13,025 13,831 14,088
Benefits, losses and loss adjustment expenses — returns credited on international
variable annuities 4,564 (1,359)(774) 3,188 (10,340)
Amortization of deferred policy acquisition costs and present value of future profits 1,988 2,444 1,692 3,125 3,049
Insurance operating costs and other expenses 5,237 5,310 5,326 5,358 5,643
Loss on extinguishment of debt 910 — — — —
Reinsurance loss on disposition, including goodwill impairment of $342 533 — — — —
Interest expense 457 508 508 476 343
Goodwill impairment —30 —32 745
Total benefits, losses and expenses 26,939 21,558 19,777 26,010 13,528
Income (loss) from continuing operations before income taxes (527) 301 2,272 (1,577)(4,591)
Income tax expense (benefit) (494)(325)572 (812) (1,817)
Income (loss) from continuing operations, net of tax (33)626 1,700 (765)(2,774)
Income (loss) from discontinued operations, net of tax (5) 86 (64)(4)10
Net income (loss) (38) 712 1,636 (769) (2,764)
Preferred stock dividends and accretion of discount 42 42 515 127 8
Net income (loss) available to common shareholders $(80) $ 670 $ 1,121 $(896) $ (2,772)
Separate account assets $141,569 $143,870 $159,742 $ 150,394 $ 130,184
Total assets 298,513 302,609 316,789 306,035 285,665
Total debt (including capital lease obligations) 7,126 6,216 6,607 5,839 6,221
Separate account liabilities 141,569 143,870 159,742 150,394 130,184
Common equity, excluding AOCI 19,048 19,679 19,188 16,696 15,135
Preferred Stock 556 556 556 2,960 —
AOCI, net of tax 2,843 1,251 (990) (3,472)(7,785)
Total stockholders’ equity 22,447 21,486 18,754 16,184 7,350
Basic $(0.17) $ 1.31 $2.75 $ (2.58) $ (9.07)
Diluted (0.17) 1.22 2.53 (2.58) (9.07)
Basic $(0.18) $ 1.51 $ 2.60 $ (2.59) $ (9.04)
Diluted (0.18)1.40 2.40 (2.59)(9.04)
Cash dividends declared per common share 0.40 0.40 0.20 0.20 1.91
Total revenues, excluding net investment income on equity securities, trading $ 21,847 $ 23,218 $ 22,823 $ 21,245 $19,277
Unlock benefit (charge), after-tax $31 $(473) $ 93 $ (846) $ (795)
Total investments, excluding equity securities, trading $ 105,317 $ 104,449 $98,175 $93,235 $89,287