The Hartford 2012 Annual Report Download - page 175
Download and view the complete annual report
Please find page 175 of the 2012 The Hartford annual report below. You can navigate through the pages in the report by either clicking on the pages listed below, or by using the keyword search tool below to find specific information within the annual report.-
 1
1 -
2
-
3
-
4
-
5
-
6
-
7
-
8
-
9
-
10
-
11
-
12
-
13
-
14
-
15
-
16
-
17
-
18
-
19
-
20
-
21
-
22
-
23
-
24
-
25
-
26
-
27
-
28
-
29
-
30
-
31
-
32
-
33
-
34
-
35
-
36
-
37
-
38
-
39
-
40
-
41
-
42
-
43
-
44
-
45
-
46
-
47
-
48
-
49
-
50
-
51
-
52
-
53
-
54
-
55
-
56
-
57
-
58
-
59
-
60
-
61
-
62
-
63
-
64
-
65
-
66
-
67
-
68
-
69
-
70
-
71
-
72
-
73
-
74
-
75
-
76
-
77
-
78
-
79
-
80
-
81
-
82
-
83
-
84
-
85
-
86
-
87
-
88
-
89
-
90
-
91
-
92
-
93
-
94
-
95
-
96
-
97
-
98
-
99
-
100
-
101
-
102
-
103
-
104
-
105
-
106
-
107
-
108
-
109
-
110
-
111
-
112
-
113
-
114
-
115
-
116
-
117
-
118
-
119
-
120
-
121
-
122
-
123
-
124
-
125
-
126
-
127
-
128
-
129
-
130
-
131
-
132
-
133
-
134
-
135
-
136
-
137
-
138
-
139
-
140
-
141
-
142
-
143
-
144
-
145
-
146
-
147
-
148
-
149
-
150
-
151
-
152
-
153
-
154
-
155
-
156
-
157
-
158
-
159
-
160
-
161
-
162
-
163
-
164
-
 165
165 -
 166
166 -
 167
167 -
 168
168 -
 169
169 -
 170
170 -
 171
171 -
 172
172 -
 173
173 -
 174
174 -
 175
175 -
 176
176 -
 177
177 -
 178
178 -
 179
179 -
 180
180 -
 181
181 -
 182
182 -
 183
183 -
 184
184 -
 185
185 -
186
-
187
-
188
-
189
-
190
-
191
-
192
-
193
-
194
-
195
-
196
-
197
-
198
-
199
-
200
-
201
-
202
-
203
-
204
-
205
-
206
-
207
-
208
-
209
-
210
-
211
-
212
-
213
-
214
-
215
-
216
-
217
-
218
-
219
-
220
-
221
-
222
-
223
-
224
-
225
-
226
-
227
-
228
-
229
-
230
-
231
-
232
-
233
-
234
-
235
-
236
-
237
-
238
-
239
-
240
-
241
-
242
-
243
-
244
-
245
-
246
-
247
-
248
-
249
-
250
-
251
-
252
-
253
-
254
-
255
-
256
-
257
-
258
-
259
-
260
-
261
-
262
-
263
-
264
-
265
-
266
-
267
-
268
-
269
-
270
-
271
-
272
-
273
-
274
-
275
-
276
-
277
-
278
-
279
-
280
-
281
-
282
-
283
-
284
-
285
-
286
-
287
-
288
-
289
-
290
-
291
-
292
-
293
-
294
-
295
-
296
-
297
-
298
-
299
-
300
-
301
-
302
-
303
-
304
-
305
-
306
-
307
-
308
-
309
-
310
-
311
-
312
-
313
-
314
-
315
-
316
-
317
-
318
-
319
-
320
-
321
-
322
-
323
-
324
-
325
-
326
-
327
-
328
-
329
-
330
-
331
-
332
-
333
-
334
-
335
 |
 |

Table of Contents
Derivative Instruments, including embedded derivatives within investments
Derivative instruments are fair valued using pricing valuation models that utilize independent market data inputs, quoted market prices for exchange-traded
derivatives, or independent broker quotations. Excluding embedded and reinsurance related derivatives, as of December 31, 2012 and 2011, 97% and 98%,
respectively, of derivatives, based upon notional values, were priced by valuation models or quoted market prices. The remaining derivatives were priced by
broker quotations. The derivatives are valued using mid-market level inputs that are predominantly observable in the market with the exception of the
customized swap contracts that hedge guaranteed minimum withdrawal benefits (“GMWB”) liabilities. Inputs used to value derivatives include, but are not
limited to, swap interest rates, foreign currency forward and spot rates, credit spreads and correlations, interest and equity volatility and equity index levels.
For further discussion, see the Derivative Instruments, including embedded derivatives within the investments section in Note 6 of the Notes to Consolidated
Financial Statements.
The Company performs various controls on derivative valuations which include both quantitative and qualitative analysis. Analyses are conducted by a
dedicated derivative pricing team that works directly with investment sector professionals to analyze impacts of changes in the market environment and
investigate variances. There is a monthly analysis to identify market value changes greater than pre-defined thresholds, stale prices, missing prices and zero
prices. Also on a monthly basis, a second source validation, typically to broker quotations, is performed for certain of the more complex derivatives, as well
as for all new deals during the month. A model validation review is performed on any new models, which typically includes detailed documentation and
validation to a second source. The model validation documentation and results of validation are presented to the Valuation Committee for approval. There is a
monthly control to review changes in pricing sources to ensure that new models are not moved to production until formally approved.
The Company utilizes derivative instruments to manage the risk associated with certain assets and liabilities. However, the derivative instrument may not be
classified with the same fair value hierarchy level as the associated assets and liabilities. Therefore the realized and unrealized gains and losses on derivatives
reported in Level 3 may not reflect the offsetting impact of the realized and unrealized gains and losses of the associated assets and liabilities.
Limited partnerships and other alternative investments
Limited partnerships and other alternative investments include hedge funds where investment company accounting has been applied to a wholly-owned fund
of funds measured at fair value. These funds are fair valued using the net asset value per share or equivalent (“NAV”), as a practical expedient, calculated on
a monthly basis and is the amount at which a unit or shareholder may redeem their investment, if redemption is allowed. Certain impediments to redemption
include, but are not limited to the following: 1) redemption notice may be required and the notice period may be as long as 90 days, 2) redemption may be
restricted (e.g. only be allowed on a quarter-end), 3) a holding period referred to as a lock-up may be imposed whereby an investor must hold their investment
for a specified period of time before they can make a notice for redemption, 4) gating provisions may limit all redemptions in a given period to a percentage of
the entities' equity interests, or may only allow an investor to redeem a portion of their investment at one time and 5) early redemption penalties may be
imposed that are expressed as a percentage of the amount redeemed. The Company will assess impediments to redemption and current market conditions that
will restrict the redemption at the end of the notice period. Any funds that are subject to significant liquidity restrictions are reported in Level 3; all others will
be classified as Level 2.
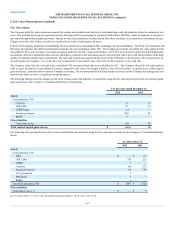
Valuation Techniques and Inputs for Investments
Generally, the Company determines the estimated fair value of its AFS securities, fixed maturities, FVO, equity securities, trading, and short-term investments
using the market approach. The income approach is used for securities priced using a pricing matrix, as well as for derivative instruments. Certain limited
partnerships and other alternative investments are measured at fair value using a NAV as a practical expedient. For Level 1 investments, which are comprised
of on-the-run U.S. Treasuries, exchange-traded equity securities, short-term investments, and exchange traded futures, option and swap contracts, valuations
are based on observable inputs that reflect quoted prices for identical assets in active markets that the Company has the ability to access at the measurement
date.
For most of the Company’s debt securities, the following inputs are typically used in the Company’s pricing methods: reported trades, benchmark yields,
bids and/or estimated cash flows. For securities except U.S. Treasuries, inputs also include issuer spreads, which may consider credit default swaps.
Derivative instruments are valued using mid-market inputs that are predominantly observable in the market.
F-33