The Hartford 2012 Annual Report Download - page 169
Download and view the complete annual report
Please find page 169 of the 2012 The Hartford annual report below. You can navigate through the pages in the report by either clicking on the pages listed below, or by using the keyword search tool below to find specific information within the annual report.-
 1
1 -
2
-
3
-
4
-
5
-
6
-
7
-
8
-
9
-
10
-
11
-
12
-
13
-
14
-
15
-
16
-
17
-
18
-
19
-
20
-
21
-
22
-
23
-
24
-
25
-
26
-
27
-
28
-
29
-
30
-
31
-
32
-
33
-
34
-
35
-
36
-
37
-
38
-
39
-
40
-
41
-
42
-
43
-
44
-
45
-
46
-
47
-
48
-
49
-
50
-
51
-
52
-
53
-
54
-
55
-
56
-
57
-
58
-
59
-
60
-
61
-
62
-
63
-
64
-
65
-
66
-
67
-
68
-
69
-
70
-
71
-
72
-
73
-
74
-
75
-
76
-
77
-
78
-
79
-
80
-
81
-
82
-
83
-
84
-
85
-
86
-
87
-
88
-
89
-
90
-
91
-
92
-
93
-
94
-
95
-
96
-
97
-
98
-
99
-
100
-
101
-
102
-
103
-
104
-
105
-
106
-
107
-
108
-
109
-
110
-
111
-
112
-
113
-
114
-
115
-
116
-
117
-
118
-
119
-
120
-
121
-
122
-
123
-
124
-
125
-
126
-
127
-
128
-
129
-
130
-
131
-
132
-
133
-
134
-
135
-
136
-
137
-
138
-
139
-
140
-
141
-
142
-
143
-
144
-
145
-
146
-
147
-
148
-
149
-
150
-
151
-
152
-
153
-
154
-
155
-
156
-
157
-
158
-
 159
159 -
 160
160 -
 161
161 -
 162
162 -
 163
163 -
 164
164 -
 165
165 -
 166
166 -
 167
167 -
 168
168 -
 169
169 -
 170
170 -
 171
171 -
 172
172 -
 173
173 -
 174
174 -
 175
175 -
 176
176 -
 177
177 -
 178
178 -
 179
179 -
180
-
181
-
182
-
183
-
184
-
185
-
186
-
187
-
188
-
189
-
190
-
191
-
192
-
193
-
194
-
195
-
196
-
197
-
198
-
199
-
200
-
201
-
202
-
203
-
204
-
205
-
206
-
207
-
208
-
209
-
210
-
211
-
212
-
213
-
214
-
215
-
216
-
217
-
218
-
219
-
220
-
221
-
222
-
223
-
224
-
225
-
226
-
227
-
228
-
229
-
230
-
231
-
232
-
233
-
234
-
235
-
236
-
237
-
238
-
239
-
240
-
241
-
242
-
243
-
244
-
245
-
246
-
247
-
248
-
249
-
250
-
251
-
252
-
253
-
254
-
255
-
256
-
257
-
258
-
259
-
260
-
261
-
262
-
263
-
264
-
265
-
266
-
267
-
268
-
269
-
270
-
271
-
272
-
273
-
274
-
275
-
276
-
277
-
278
-
279
-
280
-
281
-
282
-
283
-
284
-
285
-
286
-
287
-
288
-
289
-
290
-
291
-
292
-
293
-
294
-
295
-
296
-
297
-
298
-
299
-
300
-
301
-
302
-
303
-
304
-
305
-
306
-
307
-
308
-
309
-
310
-
311
-
312
-
313
-
314
-
315
-
316
-
317
-
318
-
319
-
320
-
321
-
322
-
323
-
324
-
325
-
326
-
327
-
328
-
329
-
330
-
331
-
332
-
333
-
334
-
335
 |
 |

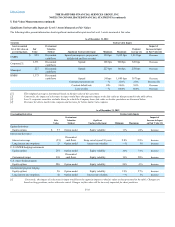
Table of Contents
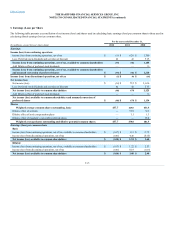
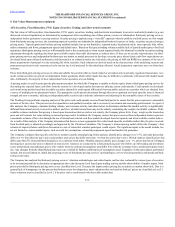
The following section applies the fair value hierarchy and disclosure requirements for the Company’s financial instruments that are carried at fair value. The
fair value hierarchy prioritizes the inputs in the valuation techniques used to measure fair value into three broad Levels (Level 1, 2 or 3).
Level 1 Observable inputs that reflect quoted prices for identical assets or liabilities in active markets that the Company has the ability to access at the
measurement date. Level 1 securities include highly liquid U.S. Treasuries, money market funds and exchange traded equity securities, open-
ended mutual funds reported in separate account assets and exchange-traded derivative securities.
Level 2 Observable inputs, other than quoted prices included in Level 1, for the asset or liability or prices for similar assets and liabilities. Most fixed
maturities and preferred stocks, including those reported in separate account assets, are model priced by vendors using observable inputs and
are classified within Level 2. Also included are limited partnerships and other alternative assets measured at fair value w here an investment can
be redeemed, or substantially redeemed, at the NAV at the measurement date or in the near-term, not to exceed 90 days.
Level 3 Valuations that are derived from techniques in which one or more of the significant inputs are unobservable (including assumptions about risk).
Level 3 securities include less liquid securities, guaranteed product embedded and reinsurance derivatives and other complex derivative
securities, as well as limited partnerships and other alternative investments carried at fair value that cannot be redeemed in the near-term at the
NAV. Because Level 3 fair values, by their nature, contain one or more significant unobservable inputs as there is little or no observable market
for these assets and liabilities, considerable judgment is used to determine the Level 3 fair values. Level 3 fair values represent the Company’s
best estimate of an amount that could be realized in a current market exchange absent actual market exchanges.
In many situations, inputs used to measure the fair value of an asset or liability position may fall into different levels of the fair value hierarchy. In these
situations, the Company will determine the level in which the fair value falls based upon the lowest level input that is significant to the determination of the fair
value. Transfers of securities among the levels occur at the beginning of the reporting period. As of December 31, 2012, the amount of transfers from Level 1
to Level 2 was $2.5 billion, which represented previously on-the-run U.S. Treasury securities that are now off-the-run, and there were no transfers from Level
2 to Level 1. In most cases, both observable (e.g., changes in interest rates) and unobservable (e.g., changes in risk assumptions) inputs are used in the
determination of fair values that the Company has classified within Level 3. Consequently, these values and the related gains and losses are based upon both
observable and unobservable inputs. The Company’s fixed maturities included in Level 3 are classified as such because these securities are primarily priced
by independent brokers and/or within illiquid markets.
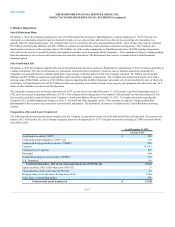
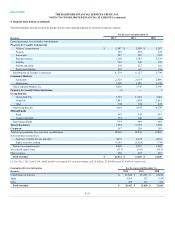
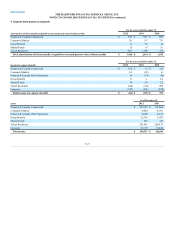
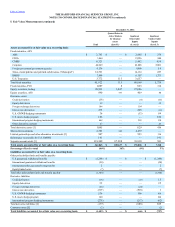
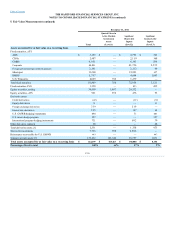
The following tables present assets and (liabilities) carried at fair value by hierarchy level. These disclosures provide information as to the extent to which the
Company uses fair value to measure financial instruments and information about the inputs used to value those financial instruments to allow users to assess
the relative reliability of the measurements. The following table presents assets and (liabilities) carried at fair value by hierarchy level.
F-28