The Hartford 2012 Annual Report Download - page 114
Download and view the complete annual report
Please find page 114 of the 2012 The Hartford annual report below. You can navigate through the pages in the report by either clicking on the pages listed below, or by using the keyword search tool below to find specific information within the annual report.-
 1
1 -
2
-
3
-
4
-
5
-
6
-
7
-
8
-
9
-
10
-
11
-
12
-
13
-
14
-
15
-
16
-
17
-
18
-
19
-
20
-
21
-
22
-
23
-
24
-
25
-
26
-
27
-
28
-
29
-
30
-
31
-
32
-
33
-
34
-
35
-
36
-
37
-
38
-
39
-
40
-
41
-
42
-
43
-
44
-
45
-
46
-
47
-
48
-
49
-
50
-
51
-
52
-
53
-
54
-
55
-
56
-
57
-
58
-
59
-
60
-
61
-
62
-
63
-
64
-
65
-
66
-
67
-
68
-
69
-
70
-
71
-
72
-
73
-
74
-
75
-
76
-
77
-
78
-
79
-
80
-
81
-
82
-
83
-
84
-
85
-
86
-
87
-
88
-
89
-
90
-
91
-
92
-
93
-
94
-
95
-
96
-
97
-
98
-
99
-
100
-
101
-
102
-
103
-
 104
104 -
 105
105 -
 106
106 -
 107
107 -
 108
108 -
 109
109 -
 110
110 -
 111
111 -
 112
112 -
 113
113 -
 114
114 -
 115
115 -
 116
116 -
 117
117 -
 118
118 -
 119
119 -
 120
120 -
 121
121 -
 122
122 -
 123
123 -
 124
124 -
125
-
126
-
127
-
128
-
129
-
130
-
131
-
132
-
133
-
134
-
135
-
136
-
137
-
138
-
139
-
140
-
141
-
142
-
143
-
144
-
145
-
146
-
147
-
148
-
149
-
150
-
151
-
152
-
153
-
154
-
155
-
156
-
157
-
158
-
159
-
160
-
161
-
162
-
163
-
164
-
165
-
166
-
167
-
168
-
169
-
170
-
171
-
172
-
173
-
174
-
175
-
176
-
177
-
178
-
179
-
180
-
181
-
182
-
183
-
184
-
185
-
186
-
187
-
188
-
189
-
190
-
191
-
192
-
193
-
194
-
195
-
196
-
197
-
198
-
199
-
200
-
201
-
202
-
203
-
204
-
205
-
206
-
207
-
208
-
209
-
210
-
211
-
212
-
213
-
214
-
215
-
216
-
217
-
218
-
219
-
220
-
221
-
222
-
223
-
224
-
225
-
226
-
227
-
228
-
229
-
230
-
231
-
232
-
233
-
234
-
235
-
236
-
237
-
238
-
239
-
240
-
241
-
242
-
243
-
244
-
245
-
246
-
247
-
248
-
249
-
250
-
251
-
252
-
253
-
254
-
255
-
256
-
257
-
258
-
259
-
260
-
261
-
262
-
263
-
264
-
265
-
266
-
267
-
268
-
269
-
270
-
271
-
272
-
273
-
274
-
275
-
276
-
277
-
278
-
279
-
280
-
281
-
282
-
283
-
284
-
285
-
286
-
287
-
288
-
289
-
290
-
291
-
292
-
293
-
294
-
295
-
296
-
297
-
298
-
299
-
300
-
301
-
302
-
303
-
304
-
305
-
306
-
307
-
308
-
309
-
310
-
311
-
312
-
313
-
314
-
315
-
316
-
317
-
318
-
319
-
320
-
321
-
322
-
323
-
324
-
325
-
326
-
327
-
328
-
329
-
330
-
331
-
332
-
333
-
334
-
335
 |
 |

Table of Contents
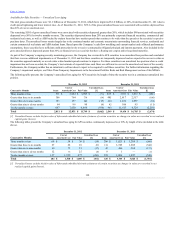
The Company continues to invest in a diversified portfolio with purchases focused on investment grade corporate bonds and additional investments into
RMBS agencies and U.S. Treasuries as a part of repurchase and dollar roll transactions. For further information on repurchase and dollar roll agreements, see
Note 6 of the Notes to the Consolidated Financial Statements. The Company also reinvested short-term investments into foreign government securities to
generate an additional return in support of Japan-related liabilities. In addition, the Company continued to prudently manage exposure to riskier assets through
selective sales of CMBS, financial and European exposures. The Company's AFS net unrealized position improved primarily as a result of improved security
valuations largely due to credit spread tightening and declining interest rates. Fixed maturities, FVO, primarily represents Japan government securities
supporting the Japan fixed annuity product, as well as securities containing an embedded credit derivative for which the Company elected the fair value option.
The underlying credit risk of the securities containing credit derivatives are primarily investment grade CRE CDOs. For further discussion on fair value
option securities, see Note 5 of the Notes to Consolidated Financial Statements.
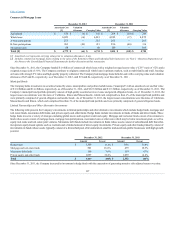
European Exposure
Many economies within Europe continue to experience significant adverse economic conditions which have been precipitated in part by high unemployment
rates and government debt levels. As a result, issuers in several European countries have experienced credit deterioration and rating downgrades and a reduced
ability to access capital markets and/or higher borrowing costs. The concerns regarding the European countries have impacted the capital markets which, in
turn, has made it more difficult to contain the European financial crisis. Austerity measures aimed at reducing sovereign debt levels, along with steps taken by
the European Central Bank to provide liquidity and credit support to certain countries issuing debt, have helped to stabilize markets to a degree recently.
However, core issues still remain. Further contraction of gross domestic product along with elevated unemployment levels may continue to put pressure on
sovereign debt.
The Company manages the credit risk associated with the European securities within the investment portfolio on an on-going basis using several processes
which are supported by macroeconomic analysis and issuer credit analysis. For additional details regarding the Company’s management of credit risk, see the
Credit Risk section of this MD&A. The Company periodically considers alternate scenarios, including a base-case and both a positive and negative “tail”
scenario that includes a partial or full break-up of the Eurozone. The outlook for key factors is evaluated, including the economic prospects for key countries,
the potential for the spread of sovereign debt contagion, and the likelihood that policymakers and politicians pursue sufficient fiscal discipline and introduce
appropriate backstops. Given the inherent uncertainty in the outcome of developments in the Eurozone, however, the Company has been focused on controlling
both absolute levels of exposure and the composition of that exposure through both bond and derivative transactions.
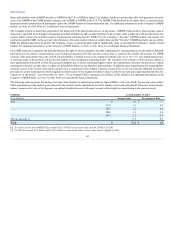
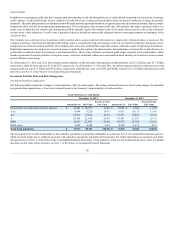
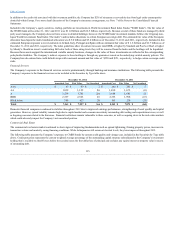
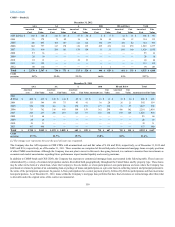
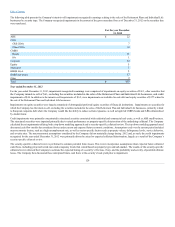
The Company has limited direct European exposure, totaling only 5% of total invested assets as of December 31, 2012. The following tables present the
Company’s European securities included in the Securities by Type table above. The Company identifies exposures with the issuers’ ultimate parent country of
domicile, which may not be the country of the security issuer. Certain European countries were separately listed below, specifically, Greece, Italy, Ireland,
Portugal and Spain (“GIIPS”), because of the current significant economic strains persisting in these countries. The criteria used for identifying the countries
separately listed includes credit default spreads that exceed the iTraxx SovX index level, an S&P credit quality rating lower than BBB and a gross domestic
product ("GDP") greater than $200 billion.
113