The Hartford 2012 Annual Report Download - page 159
Download and view the complete annual report
Please find page 159 of the 2012 The Hartford annual report below. You can navigate through the pages in the report by either clicking on the pages listed below, or by using the keyword search tool below to find specific information within the annual report.-
 1
1 -
2
-
3
-
4
-
5
-
6
-
7
-
8
-
9
-
10
-
11
-
12
-
13
-
14
-
15
-
16
-
17
-
18
-
19
-
20
-
21
-
22
-
23
-
24
-
25
-
26
-
27
-
28
-
29
-
30
-
31
-
32
-
33
-
34
-
35
-
36
-
37
-
38
-
39
-
40
-
41
-
42
-
43
-
44
-
45
-
46
-
47
-
48
-
49
-
50
-
51
-
52
-
53
-
54
-
55
-
56
-
57
-
58
-
59
-
60
-
61
-
62
-
63
-
64
-
65
-
66
-
67
-
68
-
69
-
70
-
71
-
72
-
73
-
74
-
75
-
76
-
77
-
78
-
79
-
80
-
81
-
82
-
83
-
84
-
85
-
86
-
87
-
88
-
89
-
90
-
91
-
92
-
93
-
94
-
95
-
96
-
97
-
98
-
99
-
100
-
101
-
102
-
103
-
104
-
105
-
106
-
107
-
108
-
109
-
110
-
111
-
112
-
113
-
114
-
115
-
116
-
117
-
118
-
119
-
120
-
121
-
122
-
123
-
124
-
125
-
126
-
127
-
128
-
129
-
130
-
131
-
132
-
133
-
134
-
135
-
136
-
137
-
138
-
139
-
140
-
141
-
142
-
143
-
144
-
145
-
146
-
147
-
148
-
 149
149 -
 150
150 -
 151
151 -
 152
152 -
 153
153 -
 154
154 -
 155
155 -
 156
156 -
 157
157 -
 158
158 -
 159
159 -
 160
160 -
 161
161 -
 162
162 -
 163
163 -
 164
164 -
 165
165 -
 166
166 -
 167
167 -
 168
168 -
 169
169 -
170
-
171
-
172
-
173
-
174
-
175
-
176
-
177
-
178
-
179
-
180
-
181
-
182
-
183
-
184
-
185
-
186
-
187
-
188
-
189
-
190
-
191
-
192
-
193
-
194
-
195
-
196
-
197
-
198
-
199
-
200
-
201
-
202
-
203
-
204
-
205
-
206
-
207
-
208
-
209
-
210
-
211
-
212
-
213
-
214
-
215
-
216
-
217
-
218
-
219
-
220
-
221
-
222
-
223
-
224
-
225
-
226
-
227
-
228
-
229
-
230
-
231
-
232
-
233
-
234
-
235
-
236
-
237
-
238
-
239
-
240
-
241
-
242
-
243
-
244
-
245
-
246
-
247
-
248
-
249
-
250
-
251
-
252
-
253
-
254
-
255
-
256
-
257
-
258
-
259
-
260
-
261
-
262
-
263
-
264
-
265
-
266
-
267
-
268
-
269
-
270
-
271
-
272
-
273
-
274
-
275
-
276
-
277
-
278
-
279
-
280
-
281
-
282
-
283
-
284
-
285
-
286
-
287
-
288
-
289
-
290
-
291
-
292
-
293
-
294
-
295
-
296
-
297
-
298
-
299
-
300
-
301
-
302
-
303
-
304
-
305
-
306
-
307
-
308
-
309
-
310
-
311
-
312
-
313
-
314
-
315
-
316
-
317
-
318
-
319
-
320
-
321
-
322
-
323
-
324
-
325
-
326
-
327
-
328
-
329
-
330
-
331
-
332
-
333
-
334
-
335
 |
 |

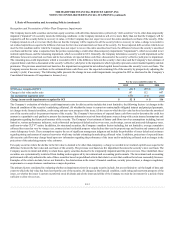
Management’s determination of the fair value of each reporting unit incorporates multiple inputs into discounted cash flow calculations, including
assumptions that market participants would make in valuing the reporting unit. Assumptions include levels of economic capital, future business growth,
earnings projections and assets under management for Mutual Funds and the reporting units within Talcott Resolution and the weighted average cost of capital
used for purposes of discounting. Decreases in the amount of economic capital allocated to a reporting unit, decreases in business growth, decreases in
earnings projections and increases in the weighted average cost of capital will all cause a reporting unit’s fair value to decrease.
Goodwill within Corporate is primarily attributed to the Company’s “buy-back” of Hartford Life, Inc. in 2000 and was allocated to each of Hartford Life’s
reporting units based on the reporting unit’s fair value of in-force business at the buy-back date. Although this goodwill was allocated to each reporting unit, it
is held in Corporate for segment reporting.
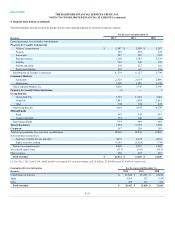
Property and Equipment
Property and equipment is carried at cost net of accumulated depreciation. Depreciation is based on the estimated useful lives of the various classes of property
and equipment and is determined principally on the straight-line method. Accumulated depreciation was $2.0 billion and $2.1 billion as of December 31,
2012 and 2011, respectively. Depreciation expense was $183, $216, and $276 for the years ended December 31, 2012, 2011 and 2010, respectively.
Separate Accounts, Death Benefits and Other Insurance Benefit Features
The Company records the variable portion of individual variable annuities, 401(k), institutional, 403(b)/457, private placement life and variable life insurance
products within separate accounts. Separate account assets are reported at fair value and separate account liabilities are reported at amounts consistent with
separate account assets. Investment income and gains and losses from those separate account assets accrue directly to the policyholder, who assumes the
related investment risk, and are offset by the related liability changes reported in the same line item in the Consolidated Statements of Operations. The
Company earns fees for investment management, certain administrative expenses, and mortality and expense risks assumed which are reported in fee income.
Certain contracts classified as universal life-type include death and other insurance benefit features including GMDB and GMIB, offered with variable
annuity contracts, or secondary guarantee benefits offered with universal life (“UL”) insurance contracts. GMDBs and GMIBs have been written in various
forms. UL secondary guarantee benefits ensure that the universal life policy will not terminate, and will continue to provide a death benefit, even if there is
insufficient policy value to cover the monthly deductions and charges. These death and other insurance benefit features require an additional liability be held
above the account value liability representing the policyholders’ funds. This liability is reported in reserve for future policy benefits in the Company’s
Consolidated Balance Sheets. Changes in the death and other insurance benefit reserves are recorded in benefits, losses and loss adjustment expenses in the
Company’s Consolidated Statements of Operations.
The death and other insurance benefit liability is determined by estimating the expected present value of the benefits in excess of the policyholder’s expected
account value in proportion to the present value of total expected assessments. The liability is accrued as actual assessments are recorded. The expected present
value of benefits and assessments are generally derived from a set of stochastic scenarios, that have been calibrated to our RTM separate account returns, and
assumptions including market rates of return, volatility, discount rates, lapse rates and mortality experience. Consistent with the Company’s policy on the
Unlock, the Company regularly evaluates estimates used and adjusts the additional liability balance, with a related charge or credit to benefits, losses and loss
adjustment expense. For further information on the Unlock, see Deferred Policy Acquisition Costs and Present Value of Future Benefits in Note 1.
The Company reinsures a portion of its in-force GMDB and UL secondary guarantees. The death and other insurance benefit reserves, net of reinsurance, are
established by estimating the expected value of net reinsurance costs and death and other insurance benefits in excess of the projected account balance. The
additional death and other insurance benefits and net reinsurance costs are recognized ratably over the accumulation period based on total expected
assessments.
F-18