The Hartford 2012 Annual Report Download - page 45
Download and view the complete annual report
Please find page 45 of the 2012 The Hartford annual report below. You can navigate through the pages in the report by either clicking on the pages listed below, or by using the keyword search tool below to find specific information within the annual report.-
 1
1 -
2
-
3
-
4
-
5
-
6
-
7
-
8
-
9
-
10
-
11
-
12
-
13
-
14
-
15
-
16
-
17
-
18
-
19
-
20
-
21
-
22
-
23
-
24
-
25
-
26
-
27
-
28
-
29
-
30
-
31
-
32
-
33
-
34
-
 35
35 -
 36
36 -
 37
37 -
 38
38 -
 39
39 -
 40
40 -
 41
41 -
 42
42 -
 43
43 -
 44
44 -
 45
45 -
 46
46 -
 47
47 -
 48
48 -
 49
49 -
 50
50 -
 51
51 -
 52
52 -
 53
53 -
 54
54 -
 55
55 -
56
-
57
-
58
-
59
-
60
-
61
-
62
-
63
-
64
-
65
-
66
-
67
-
68
-
69
-
70
-
71
-
72
-
73
-
74
-
75
-
76
-
77
-
78
-
79
-
80
-
81
-
82
-
83
-
84
-
85
-
86
-
87
-
88
-
89
-
90
-
91
-
92
-
93
-
94
-
95
-
96
-
97
-
98
-
99
-
100
-
101
-
102
-
103
-
104
-
105
-
106
-
107
-
108
-
109
-
110
-
111
-
112
-
113
-
114
-
115
-
116
-
117
-
118
-
119
-
120
-
121
-
122
-
123
-
124
-
125
-
126
-
127
-
128
-
129
-
130
-
131
-
132
-
133
-
134
-
135
-
136
-
137
-
138
-
139
-
140
-
141
-
142
-
143
-
144
-
145
-
146
-
147
-
148
-
149
-
150
-
151
-
152
-
153
-
154
-
155
-
156
-
157
-
158
-
159
-
160
-
161
-
162
-
163
-
164
-
165
-
166
-
167
-
168
-
169
-
170
-
171
-
172
-
173
-
174
-
175
-
176
-
177
-
178
-
179
-
180
-
181
-
182
-
183
-
184
-
185
-
186
-
187
-
188
-
189
-
190
-
191
-
192
-
193
-
194
-
195
-
196
-
197
-
198
-
199
-
200
-
201
-
202
-
203
-
204
-
205
-
206
-
207
-
208
-
209
-
210
-
211
-
212
-
213
-
214
-
215
-
216
-
217
-
218
-
219
-
220
-
221
-
222
-
223
-
224
-
225
-
226
-
227
-
228
-
229
-
230
-
231
-
232
-
233
-
234
-
235
-
236
-
237
-
238
-
239
-
240
-
241
-
242
-
243
-
244
-
245
-
246
-
247
-
248
-
249
-
250
-
251
-
252
-
253
-
254
-
255
-
256
-
257
-
258
-
259
-
260
-
261
-
262
-
263
-
264
-
265
-
266
-
267
-
268
-
269
-
270
-
271
-
272
-
273
-
274
-
275
-
276
-
277
-
278
-
279
-
280
-
281
-
282
-
283
-
284
-
285
-
286
-
287
-
288
-
289
-
290
-
291
-
292
-
293
-
294
-
295
-
296
-
297
-
298
-
299
-
300
-
301
-
302
-
303
-
304
-
305
-
306
-
307
-
308
-
309
-
310
-
311
-
312
-
313
-
314
-
315
-
316
-
317
-
318
-
319
-
320
-
321
-
322
-
323
-
324
-
325
-
326
-
327
-
328
-
329
-
330
-
331
-
332
-
333
-
334
-
335
 |
 |

Table of Contents
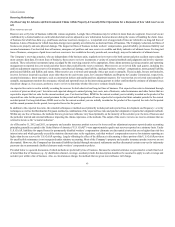
Property and Auto Physical Damage. These lines are fast-developing and paid and reported development techniques are used as these methods use historical
data to develop paid and reported loss development patterns, which are then applied to current paid and reported losses by accident period to estimate ultimate
losses. The Company relies primarily on reported development techniques although a review of frequency and severity and the initial loss expectation based on
the expected loss ratio is used for the most immature accident months. The advantage of frequency / severity techniques is that frequency estimates are
generally easier to predict and external information can be used to supplement internal data in making severity estimates.
Personal Auto Liability. For auto liability, and bodily injury in particular, the Company performs a greater number of techniques than it does for property
and auto physical damage. In addition, because the paid development technique is affected by changes in claim closure patterns and the reported development
method is affected by changes in case reserving practices, the Company uses Berquist-Sherman techniques which adjust these patterns to reflect current
settlement rates and case reserving techniques. The Company generally uses the reported development method for older accident years as a higher percentage of
ultimate losses are reflected in reported losses than in cumulative paid losses and the frequency/severity and Berquist-Sherman methods for more recent
accident years. Recent periods are influenced by changes in case reserve practices and changing disposal rates; the frequency/severity techniques are not
affected as much by these changes and the Berquist-Sherman techniques specifically adjust for these changes.
Auto Liability for Commercial Lines and Short-Tailed General Liability. The Company performs a variety of techniques, including the paid and reported
development methods and frequency / severity techniques. For older, more mature accident years, the Company finds that reported development techniques are
best. For more recent accident years, the Company typically prefers frequency / severity techniques that make separate assumptions about loss activity above
and below a selected capping level.
Long-Tailed General Liability, Fidelity and Surety and Large Deductible Workers’ Compensation. For these long-tailed lines of business, the Company
generally relies on the expected loss ratio and reported development techniques. The Company generally weights these techniques together, relying more heavily
on the expected loss ratio method at early ages of development and more on the reported development method as an accident year matures.
Workers’ Compensation. Workers’ compensation is the Company’s single largest reserve line of business so a wide range of methods are reviewed in the
reserve analysis. Methods performed include paid and reported development, variations on expected loss ratio methods, and an in-depth analysis on the largest
states. Historically, paid development patterns in the Company’s workers’ compensation business have been stable, so paid techniques are preferred. Although
paid techniques may be less predictive of the ultimate liability when a low percentage of ultimate losses are paid as in early periods of development, recent
changes in the frequency of workers’ compensation claims have caused the Company to place greater reliance on paid methods with continued consideration of
the state-by-state analysis and the expected loss ratio approach.
Professional Liability. Reported and paid loss developments patterns for this line tend to be volatile. Therefore, the Company typically relies on frequency and
severity techniques.
Assumed Reinsurance and All Other. For these lines, the Company tends to rely on the reported development techniques. In assumed reinsurance,
assumptions are influenced by information gained from claim and underwriting audits.
Allocated Loss Adjustment Expenses (ALAE). For some lines of business (e.g., professional liability and assumed reinsurance), ALAE and losses are
analyzed together. For most lines of business, however, ALAE is analyzed separately, using paid development techniques and an analysis of the relationship
between ALAE and loss payments.
Unallocated Loss Adjustment Expense (ULAE). ULAE is analyzed separately from loss and ALAE. For most lines of business, incurred ULAE costs to be
paid in the future are projected based on an expected cost per claim year and the anticipated claim closure pattern and the ratio of paid ULAE to paid loss.
The final step in the reserve review process involves a comprehensive review by senior reserving actuaries who apply their judgment and, in concert with
senior management, determine the appropriate level of reserves based on the information that has been accumulated. Numerous factors are considered in this
process including, but not limited to, the assessed reliability of key loss trends and assumptions that may be significantly influencing the current actuarial
indications, pertinent trends observed over the recent past, the level of volatility within a particular line of business, and the improvement or deterioration of
actuarial indications in the current period as compared to the prior periods. Total recorded net reserves, excluding asbestos and environmental, were 1.8%
higher than the actuarial indication of the reserves as of December 31, 2012.
See the Reserve Development section for a discussion of changes to reserve estimates recorded in 2012.
44