The Hartford 2012 Annual Report Download - page 117
Download and view the complete annual report
Please find page 117 of the 2012 The Hartford annual report below. You can navigate through the pages in the report by either clicking on the pages listed below, or by using the keyword search tool below to find specific information within the annual report.-
 1
1 -
2
-
3
-
4
-
5
-
6
-
7
-
8
-
9
-
10
-
11
-
12
-
13
-
14
-
15
-
16
-
17
-
18
-
19
-
20
-
21
-
22
-
23
-
24
-
25
-
26
-
27
-
28
-
29
-
30
-
31
-
32
-
33
-
34
-
35
-
36
-
37
-
38
-
39
-
40
-
41
-
42
-
43
-
44
-
45
-
46
-
47
-
48
-
49
-
50
-
51
-
52
-
53
-
54
-
55
-
56
-
57
-
58
-
59
-
60
-
61
-
62
-
63
-
64
-
65
-
66
-
67
-
68
-
69
-
70
-
71
-
72
-
73
-
74
-
75
-
76
-
77
-
78
-
79
-
80
-
81
-
82
-
83
-
84
-
85
-
86
-
87
-
88
-
89
-
90
-
91
-
92
-
93
-
94
-
95
-
96
-
97
-
98
-
99
-
100
-
101
-
102
-
103
-
104
-
105
-
106
-
 107
107 -
 108
108 -
 109
109 -
 110
110 -
 111
111 -
 112
112 -
 113
113 -
 114
114 -
 115
115 -
 116
116 -
 117
117 -
 118
118 -
 119
119 -
 120
120 -
 121
121 -
 122
122 -
 123
123 -
 124
124 -
 125
125 -
 126
126 -
 127
127 -
128
-
129
-
130
-
131
-
132
-
133
-
134
-
135
-
136
-
137
-
138
-
139
-
140
-
141
-
142
-
143
-
144
-
145
-
146
-
147
-
148
-
149
-
150
-
151
-
152
-
153
-
154
-
155
-
156
-
157
-
158
-
159
-
160
-
161
-
162
-
163
-
164
-
165
-
166
-
167
-
168
-
169
-
170
-
171
-
172
-
173
-
174
-
175
-
176
-
177
-
178
-
179
-
180
-
181
-
182
-
183
-
184
-
185
-
186
-
187
-
188
-
189
-
190
-
191
-
192
-
193
-
194
-
195
-
196
-
197
-
198
-
199
-
200
-
201
-
202
-
203
-
204
-
205
-
206
-
207
-
208
-
209
-
210
-
211
-
212
-
213
-
214
-
215
-
216
-
217
-
218
-
219
-
220
-
221
-
222
-
223
-
224
-
225
-
226
-
227
-
228
-
229
-
230
-
231
-
232
-
233
-
234
-
235
-
236
-
237
-
238
-
239
-
240
-
241
-
242
-
243
-
244
-
245
-
246
-
247
-
248
-
249
-
250
-
251
-
252
-
253
-
254
-
255
-
256
-
257
-
258
-
259
-
260
-
261
-
262
-
263
-
264
-
265
-
266
-
267
-
268
-
269
-
270
-
271
-
272
-
273
-
274
-
275
-
276
-
277
-
278
-
279
-
280
-
281
-
282
-
283
-
284
-
285
-
286
-
287
-
288
-
289
-
290
-
291
-
292
-
293
-
294
-
295
-
296
-
297
-
298
-
299
-
300
-
301
-
302
-
303
-
304
-
305
-
306
-
307
-
308
-
309
-
310
-
311
-
312
-
313
-
314
-
315
-
316
-
317
-
318
-
319
-
320
-
321
-
322
-
323
-
324
-
325
-
326
-
327
-
328
-
329
-
330
-
331
-
332
-
333
-
334
-
335
 |
 |

Table of Contents
2003 & Prior $180 $184 $102 $103 $ 57 $ 56 $ 5 $ 5 $ 42 $43 $386 $391
2004 171 178 73 82 36 36 24 24 20 12 324 332
2005 446 485 105 107 121 122 152 139 100 82 924 935
2006 682 757 167 178 129 135 235 229 316 278 1,529 1,577
2007 371 409 289 301 150 154 31 31 188 160 1,029 1,055
2008 55 66 — — — — — — — — 55 66
2009 28 30 — — — — — — — — 28 30
2010 18 21 — — 22 23 — — — — 40 44
2011 121 135 — — — — — — — — 121 135
2012 98 102 — — — — 1 1 — — 99 103
2003
& Prior $408 $415 $148 $144 $ 83 $ 81 $ 16 $13 $33 $30 $688 $683
2004 333 349 68 75 45 41 30 28 26 21 502 514
2005 520 556 101 96 178 151 177 138 71 57 1,047 998
2006 713 762 516 493 180 159 362 298 430 302 2,201 2,014
2007 245 267 296 275 123 97 166 130 195 149 1,025 918
2008 55 60 — — — — — — — — 55 60
2009 28 29 — — — — — — — — 28 29
2010 29 31 — — — — — — — — 29 31
2011 417 440 — — — — — — — — 417 440
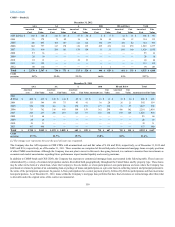
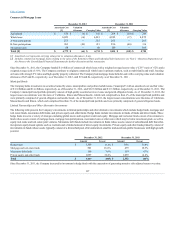
[1] The vintage year represents the year the pool of loans was originated.
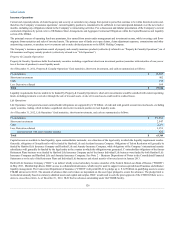
The Company also has AFS exposure to CRE CDOs with an amortized cost and fair value of $ 420 and $384, respectively, as of December 31, 2012 and
$485 and $334, respectively, as of December 31, 2011. These securities are comprised of diversified pools of commercial mortgage loans or equity positions
of other CMBS securitizations. Although the Company does not plan to invest in this asset class going forward, we continue to monitor these investments as
economic and market uncertainties regarding future performance impact market liquidity and security premiums.
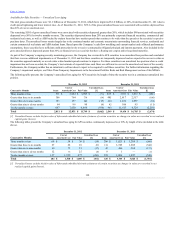
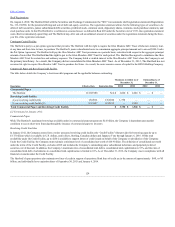
In addition to CMBS bonds and CRE CDOs, the Company has exposure to commercial mortgage loans as presented in the following table. These loans are
collateralized by a variety of commercial properties and are diversified both geographically throughout the United States and by property type. These loans
may be either in the form of a whole loan, where the Company is the sole lender, or a loan participation. Loan participations are loans where the Company has
purchased or retained a portion of an outstanding loan or package of loans and participates on a pro-rata basis in collecting interest and principal pursuant to
the terms of the participation agreement. In general, A-Note participations have senior payment priority, followed by B-Note participations and then mezzanine
loan participations. As of December 31, 2012, loans within the Company’s mortgage loan portfolio that have had extensions or restructurings other than what
is allowable under the original terms of the contract are immaterial.
116