The Hartford 2012 Annual Report Download - page 41
Download and view the complete annual report
Please find page 41 of the 2012 The Hartford annual report below. You can navigate through the pages in the report by either clicking on the pages listed below, or by using the keyword search tool below to find specific information within the annual report.-
 1
1 -
2
-
3
-
4
-
5
-
6
-
7
-
8
-
9
-
10
-
11
-
12
-
13
-
14
-
15
-
16
-
17
-
18
-
19
-
20
-
21
-
22
-
23
-
24
-
25
-
26
-
27
-
28
-
29
-
30
-
 31
31 -
 32
32 -
 33
33 -
 34
34 -
 35
35 -
 36
36 -
 37
37 -
 38
38 -
 39
39 -
 40
40 -
 41
41 -
 42
42 -
 43
43 -
 44
44 -
 45
45 -
 46
46 -
 47
47 -
 48
48 -
 49
49 -
 50
50 -
 51
51 -
52
-
53
-
54
-
55
-
56
-
57
-
58
-
59
-
60
-
61
-
62
-
63
-
64
-
65
-
66
-
67
-
68
-
69
-
70
-
71
-
72
-
73
-
74
-
75
-
76
-
77
-
78
-
79
-
80
-
81
-
82
-
83
-
84
-
85
-
86
-
87
-
88
-
89
-
90
-
91
-
92
-
93
-
94
-
95
-
96
-
97
-
98
-
99
-
100
-
101
-
102
-
103
-
104
-
105
-
106
-
107
-
108
-
109
-
110
-
111
-
112
-
113
-
114
-
115
-
116
-
117
-
118
-
119
-
120
-
121
-
122
-
123
-
124
-
125
-
126
-
127
-
128
-
129
-
130
-
131
-
132
-
133
-
134
-
135
-
136
-
137
-
138
-
139
-
140
-
141
-
142
-
143
-
144
-
145
-
146
-
147
-
148
-
149
-
150
-
151
-
152
-
153
-
154
-
155
-
156
-
157
-
158
-
159
-
160
-
161
-
162
-
163
-
164
-
165
-
166
-
167
-
168
-
169
-
170
-
171
-
172
-
173
-
174
-
175
-
176
-
177
-
178
-
179
-
180
-
181
-
182
-
183
-
184
-
185
-
186
-
187
-
188
-
189
-
190
-
191
-
192
-
193
-
194
-
195
-
196
-
197
-
198
-
199
-
200
-
201
-
202
-
203
-
204
-
205
-
206
-
207
-
208
-
209
-
210
-
211
-
212
-
213
-
214
-
215
-
216
-
217
-
218
-
219
-
220
-
221
-
222
-
223
-
224
-
225
-
226
-
227
-
228
-
229
-
230
-
231
-
232
-
233
-
234
-
235
-
236
-
237
-
238
-
239
-
240
-
241
-
242
-
243
-
244
-
245
-
246
-
247
-
248
-
249
-
250
-
251
-
252
-
253
-
254
-
255
-
256
-
257
-
258
-
259
-
260
-
261
-
262
-
263
-
264
-
265
-
266
-
267
-
268
-
269
-
270
-
271
-
272
-
273
-
274
-
275
-
276
-
277
-
278
-
279
-
280
-
281
-
282
-
283
-
284
-
285
-
286
-
287
-
288
-
289
-
290
-
291
-
292
-
293
-
294
-
295
-
296
-
297
-
298
-
299
-
300
-
301
-
302
-
303
-
304
-
305
-
306
-
307
-
308
-
309
-
310
-
311
-
312
-
313
-
314
-
315
-
316
-
317
-
318
-
319
-
320
-
321
-
322
-
323
-
324
-
325
-
326
-
327
-
328
-
329
-
330
-
331
-
332
-
333
-
334
-
335
 |
 |

Table of Contents
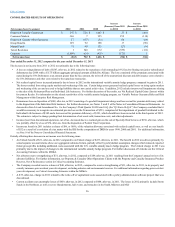
Consumer Markets
The Company expects written premiums to be flat to slightly higher in 2013 compared to 2012, with growth in business sold through independent agents to
AARP members and flat to slightly higher written premium for AARP Direct. In 2013, management expects an increase in new business and improvement in
premium retention as the effect of renewal written price increases on retained business is anticipated to more than offset a slight decline in policy retention.
Within the Agency channel, management expects written premiums from policyholders other than AARP members to decline, driven by continued pricing and
underwriting actions to improve profitability, including efforts to reposition the book into more mature, preferred market business. Management expects that
the combined ratio before catastrophes and prior accident year development will be between approximately 89.5 and 92.5 for full year 2013 compared to the
90.8 achieved in 2012. For auto, the current accident year loss and loss adjustment expense ratio before catastrophes is expected to improve slightly for the
2013 full year driven by anticipated earned pricing increases that outpace slightly lower claim frequency and higher average claim severity. For homeowners,
the current accident year loss and loss adjustment expense ratio before catastrophes is expected to increase in 2013, driven by an expected return to more
normal non-catastrophe weather claim frequency after experiencing very favorable non-catastrophe weather claim frequency in 2012.
Group Benefits
Group Benefits premiums are expected to decline for 2013 as compared to 2012, reflecting the competitive environment coupled with pricing discipline with
respect to new sales and renewals with the goal of improving profitability. Specifically, Group Benefits did not renew its largest account effective January 1,
2013 due to pricing and other considerations. Overall, the reductions to premiums will not significantly impact Group Benefits profitability due to expected
improvements in the disability loss ratio as a result of pricing actions and improvements in claims management. The Company expects Group Benefits'
disability results to improve, contributing to a loss ratio between approximately 77 and 80 for full year 2013 as compared to the 79.5 achieved in 2012.
Mutual Funds
Mutual Funds has been offering new funds to improve our participation in asset classes where we see potential growth opportunities. Wellington now serves as
the primary sub-advisor for The Hartford’s retail mutual funds, including equity, fixed-income and asset-allocation funds.
Talcott Resolution
The principal goal for Talcott Resolution is to reduce the size and risk associated with the Company's U.S. and international in-force variable annuities. As a
result, the Company expects account values and consequently earnings to decline over time as fees decrease due to surrenders, policyholder initiatives or
transactions with third parties that will reduce the size of this legacy book of business. Our international variable annuity business will also continue to be a
significant driver of earnings variability due to hedge programs which generate mark to market gains and losses while the underlying international liabilities
being hedged are not marked to market. This can result in unpredictable earnings volatility period to period.
40