The Hartford 2012 Annual Report Download - page 86
Download and view the complete annual report
Please find page 86 of the 2012 The Hartford annual report below. You can navigate through the pages in the report by either clicking on the pages listed below, or by using the keyword search tool below to find specific information within the annual report.-
 1
1 -
2
-
3
-
4
-
5
-
6
-
7
-
8
-
9
-
10
-
11
-
12
-
13
-
14
-
15
-
16
-
17
-
18
-
19
-
20
-
21
-
22
-
23
-
24
-
25
-
26
-
27
-
28
-
29
-
30
-
31
-
32
-
33
-
34
-
35
-
36
-
37
-
38
-
39
-
40
-
41
-
42
-
43
-
44
-
45
-
46
-
47
-
48
-
49
-
50
-
51
-
52
-
53
-
54
-
55
-
56
-
57
-
58
-
59
-
60
-
61
-
62
-
63
-
64
-
65
-
66
-
67
-
68
-
69
-
70
-
71
-
72
-
73
-
74
-
75
-
 76
76 -
 77
77 -
 78
78 -
 79
79 -
 80
80 -
 81
81 -
 82
82 -
 83
83 -
 84
84 -
 85
85 -
 86
86 -
 87
87 -
 88
88 -
 89
89 -
 90
90 -
 91
91 -
 92
92 -
 93
93 -
 94
94 -
 95
95 -
 96
96 -
97
-
98
-
99
-
100
-
101
-
102
-
103
-
104
-
105
-
106
-
107
-
108
-
109
-
110
-
111
-
112
-
113
-
114
-
115
-
116
-
117
-
118
-
119
-
120
-
121
-
122
-
123
-
124
-
125
-
126
-
127
-
128
-
129
-
130
-
131
-
132
-
133
-
134
-
135
-
136
-
137
-
138
-
139
-
140
-
141
-
142
-
143
-
144
-
145
-
146
-
147
-
148
-
149
-
150
-
151
-
152
-
153
-
154
-
155
-
156
-
157
-
158
-
159
-
160
-
161
-
162
-
163
-
164
-
165
-
166
-
167
-
168
-
169
-
170
-
171
-
172
-
173
-
174
-
175
-
176
-
177
-
178
-
179
-
180
-
181
-
182
-
183
-
184
-
185
-
186
-
187
-
188
-
189
-
190
-
191
-
192
-
193
-
194
-
195
-
196
-
197
-
198
-
199
-
200
-
201
-
202
-
203
-
204
-
205
-
206
-
207
-
208
-
209
-
210
-
211
-
212
-
213
-
214
-
215
-
216
-
217
-
218
-
219
-
220
-
221
-
222
-
223
-
224
-
225
-
226
-
227
-
228
-
229
-
230
-
231
-
232
-
233
-
234
-
235
-
236
-
237
-
238
-
239
-
240
-
241
-
242
-
243
-
244
-
245
-
246
-
247
-
248
-
249
-
250
-
251
-
252
-
253
-
254
-
255
-
256
-
257
-
258
-
259
-
260
-
261
-
262
-
263
-
264
-
265
-
266
-
267
-
268
-
269
-
270
-
271
-
272
-
273
-
274
-
275
-
276
-
277
-
278
-
279
-
280
-
281
-
282
-
283
-
284
-
285
-
286
-
287
-
288
-
289
-
290
-
291
-
292
-
293
-
294
-
295
-
296
-
297
-
298
-
299
-
300
-
301
-
302
-
303
-
304
-
305
-
306
-
307
-
308
-
309
-
310
-
311
-
312
-
313
-
314
-
315
-
316
-
317
-
318
-
319
-
320
-
321
-
322
-
323
-
324
-
325
-
326
-
327
-
328
-
329
-
330
-
331
-
332
-
333
-
334
-
335
 |
 |

Table of Contents
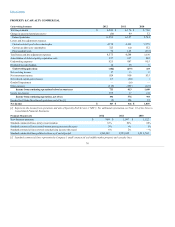
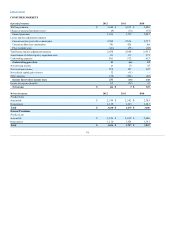
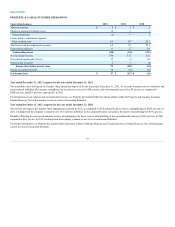
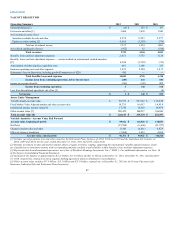
Year ended December 31, 2012 compared to the year ended December 31, 2011
Net income, as compared to the prior year period, increased for the year ended December 31, 2012. While realized capital gains improved in current year, this
was partially offset by a decrease in fully insured ongoing premiums, due to the lower sales and persistency resulting from the Company's pricing initiatives
as well as the competitive market environment.
The change in insurance operating costs and other expenses is due to lower commission payments as a result of lower sales and a onetime payment to a third
party administrator in the first quarter of 2011.
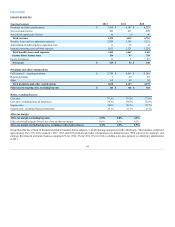
Group Benefits' loss ratio remained flat for both years 2012 and 2011. Loss experience in 2012 reflects stable incidence trends during the year, although
elevated when compared to historical levels, and a continuation of the slightly improving claim terminations in group long-term disability that emerged in mid-
2012. Group life claims experience deteriorated modestly compared with 2011 but remained more favorable than group long-term disability.
The increase in Group Benefits' after-tax margin (excluding buyouts), excluding realized gains (losses), was primarily due to lower insurance operating costs
and other expenses, partially offset by the impact of lower premiums and other considerations due to lower sales and persistency.
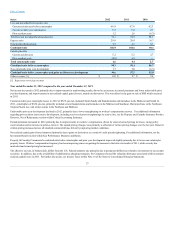
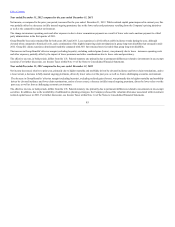
The effective tax rate, in both periods, differs from the U.S. Federal statutory rate primarily due to permanent differences related to investments in tax exempt
securities. For further discussion, see Income Taxes within Note 14 of the Notes to Consolidated Financial Statements.
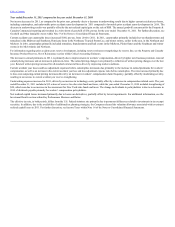
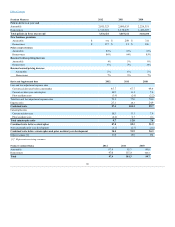
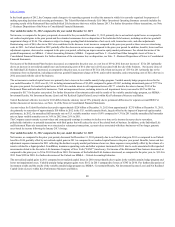
Year ended December 31, 2011 compared to the year ended December 31, 2010
Net income decreased, relative to prior year, primarily due to higher mortality and morbidity driven by elevated incidence and lower claim terminations, and to
a lesser extent, a decrease in fully insured ongoing premiums, driven by lower sales over the past year, as well as, from a challenging economic environment.
The decrease in Group Benefits’ after-tax margin (excluding buyouts), excluding realized gains (losses), was primarily due to higher mortality and morbidity
driven by elevated incidence and lower claim terminations, and to a lesser extent, a decrease in fully insured ongoing premiums, driven by lower sales over the
past year, as well as from a challenging economic environment.
The effective tax rate, in both periods, differs from the U.S. Federal statutory rate primarily due to permanent differences related to investments in tax exempt
securities. In addition, due to the availability of additional tax planning strategies, the Company released the valuation allowance associated with investment
realized capital losses in 2011. For further discussion, see Income Taxes within Note 14 of the Notes to Consolidated Financial Statements.
85