The Hartford 2012 Annual Report Download - page 112
Download and view the complete annual report
Please find page 112 of the 2012 The Hartford annual report below. You can navigate through the pages in the report by either clicking on the pages listed below, or by using the keyword search tool below to find specific information within the annual report.-
 1
1 -
2
-
3
-
4
-
5
-
6
-
7
-
8
-
9
-
10
-
11
-
12
-
13
-
14
-
15
-
16
-
17
-
18
-
19
-
20
-
21
-
22
-
23
-
24
-
25
-
26
-
27
-
28
-
29
-
30
-
31
-
32
-
33
-
34
-
35
-
36
-
37
-
38
-
39
-
40
-
41
-
42
-
43
-
44
-
45
-
46
-
47
-
48
-
49
-
50
-
51
-
52
-
53
-
54
-
55
-
56
-
57
-
58
-
59
-
60
-
61
-
62
-
63
-
64
-
65
-
66
-
67
-
68
-
69
-
70
-
71
-
72
-
73
-
74
-
75
-
76
-
77
-
78
-
79
-
80
-
81
-
82
-
83
-
84
-
85
-
86
-
87
-
88
-
89
-
90
-
91
-
92
-
93
-
94
-
95
-
96
-
97
-
98
-
99
-
100
-
101
-
 102
102 -
 103
103 -
 104
104 -
 105
105 -
 106
106 -
 107
107 -
 108
108 -
 109
109 -
 110
110 -
 111
111 -
 112
112 -
 113
113 -
 114
114 -
 115
115 -
 116
116 -
 117
117 -
 118
118 -
 119
119 -
 120
120 -
 121
121 -
 122
122 -
123
-
124
-
125
-
126
-
127
-
128
-
129
-
130
-
131
-
132
-
133
-
134
-
135
-
136
-
137
-
138
-
139
-
140
-
141
-
142
-
143
-
144
-
145
-
146
-
147
-
148
-
149
-
150
-
151
-
152
-
153
-
154
-
155
-
156
-
157
-
158
-
159
-
160
-
161
-
162
-
163
-
164
-
165
-
166
-
167
-
168
-
169
-
170
-
171
-
172
-
173
-
174
-
175
-
176
-
177
-
178
-
179
-
180
-
181
-
182
-
183
-
184
-
185
-
186
-
187
-
188
-
189
-
190
-
191
-
192
-
193
-
194
-
195
-
196
-
197
-
198
-
199
-
200
-
201
-
202
-
203
-
204
-
205
-
206
-
207
-
208
-
209
-
210
-
211
-
212
-
213
-
214
-
215
-
216
-
217
-
218
-
219
-
220
-
221
-
222
-
223
-
224
-
225
-
226
-
227
-
228
-
229
-
230
-
231
-
232
-
233
-
234
-
235
-
236
-
237
-
238
-
239
-
240
-
241
-
242
-
243
-
244
-
245
-
246
-
247
-
248
-
249
-
250
-
251
-
252
-
253
-
254
-
255
-
256
-
257
-
258
-
259
-
260
-
261
-
262
-
263
-
264
-
265
-
266
-
267
-
268
-
269
-
270
-
271
-
272
-
273
-
274
-
275
-
276
-
277
-
278
-
279
-
280
-
281
-
282
-
283
-
284
-
285
-
286
-
287
-
288
-
289
-
290
-
291
-
292
-
293
-
294
-
295
-
296
-
297
-
298
-
299
-
300
-
301
-
302
-
303
-
304
-
305
-
306
-
307
-
308
-
309
-
310
-
311
-
312
-
313
-
314
-
315
-
316
-
317
-
318
-
319
-
320
-
321
-
322
-
323
-
324
-
325
-
326
-
327
-
328
-
329
-
330
-
331
-
332
-
333
-
334
-
335
 |
 |
Table of Contents
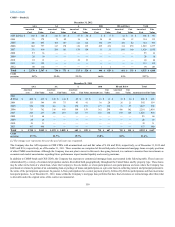
In addition to counterparty credit risk, the Company may also introduce credit risk through the use of credit default swaps that are entered into to manage
credit exposure. Credit default swaps involve a transfer of credit risk of one or many referenced entities from one party to another in exchange for periodic
payments. The party that purchases credit protection will make periodic payments based on an agreed upon rate and notional amount, and for certain
transactions there will also be an upfront premium payment. The second party, who assumes credit risk, will typically only make a payment if there is a
credit event as defined in the contract and such payment will be typically equal to the notional value of the swap contract less the value of the referenced
security issuer’s debt obligation. A credit event is generally defined as default on contractually obligated interest or principal payments or bankruptcy of the
referenced entity.
The Company uses credit derivatives to purchase credit protection and to assume credit risk with respect to a single entity, referenced index, or asset pool. The
Company purchases credit protection through credit default swaps to economically hedge and manage credit risk of certain fixed maturity investments across
multiple sectors of the investment portfolio. The Company also enters into credit default swaps that assume credit risk as part of replication transactions.
Replication transactions are used as an economical means to synthetically replicate the characteristics and performance of assets that would otherwise be
permissible investments under the Company’s investment policies. These swaps reference investment grade single corporate issuers and baskets, which
include customized diversified portfolios of corporate issuers, which are established within sector concentration limits and may be divided into tranches which
possess different credit ratings.
As of December 31, 2012 and 2011, the notional amount related to credit derivatives that purchase credit protection was $ 2.2 billion and $1.7 billion,
respectively, while the fair value was $21 and $36, respectively. As of December 31, 2012 and 2011, the notional amount related to credit derivatives that
assume credit risk was $2.7 billion and $3.0 billion, respectively, while the fair value was $(29) and $(648), respectively. For further information on credit
derivatives, see Note 6 of the Notes to Consolidated Financial Statements.
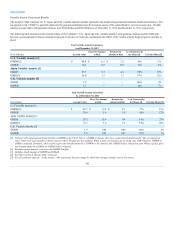
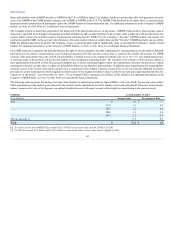
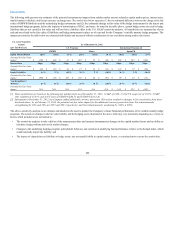
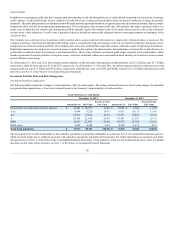
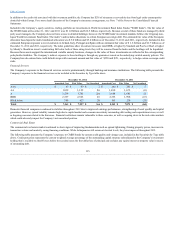
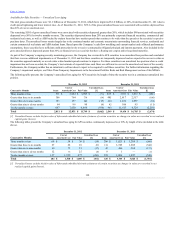
Investment Portfolio Composition
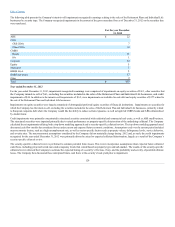
The following table presents the Company’s fixed maturities, AFS, by credit quality. The ratings referenced below are based on the ratings of a nationally
recognized rating organization or, if not rated, assigned based on the Company’s internal analysis of such securities.
United States Government/Government agencies $10,481 $10,975 12.8%$8,901 $9,364 11.4%
AAA 8,646 9,220 10.7%9,631 10,113 12.4%
AA 14,939 16,104 18.7%15,471 15,844 19.4%
A20,396 22,650 26.4%19,501 21,053 25.7%
BBB 20,833 22,689 26.4%20,972 21,760 26.6%
BB & below 4,452 4,284 5.0%4,502 3,675 4.5%
The movement in the overall credit quality of the Company’s portfolio was primarily attributable to an increase in U.S. Government/Government agencies,
which increased largely due to collateral associated with repurchase agreements and dollar roll transactions. For further information on repurchase and dollar
roll agreements, see Note 6 of the Notes to the Consolidated Financial Statements. Fixed maturities, FVO, are not included in the above table. For further
discussion on fair value option securities, see Note 5 of the Notes to Consolidated Financial Statements.
111