The Hartford 2012 Annual Report Download - page 236
Download and view the complete annual report
Please find page 236 of the 2012 The Hartford annual report below. You can navigate through the pages in the report by either clicking on the pages listed below, or by using the keyword search tool below to find specific information within the annual report.-
 1
1 -
2
-
3
-
4
-
5
-
6
-
7
-
8
-
9
-
10
-
11
-
12
-
13
-
14
-
15
-
16
-
17
-
18
-
19
-
20
-
21
-
22
-
23
-
24
-
25
-
26
-
27
-
28
-
29
-
30
-
31
-
32
-
33
-
34
-
35
-
36
-
37
-
38
-
39
-
40
-
41
-
42
-
43
-
44
-
45
-
46
-
47
-
48
-
49
-
50
-
51
-
52
-
53
-
54
-
55
-
56
-
57
-
58
-
59
-
60
-
61
-
62
-
63
-
64
-
65
-
66
-
67
-
68
-
69
-
70
-
71
-
72
-
73
-
74
-
75
-
76
-
77
-
78
-
79
-
80
-
81
-
82
-
83
-
84
-
85
-
86
-
87
-
88
-
89
-
90
-
91
-
92
-
93
-
94
-
95
-
96
-
97
-
98
-
99
-
100
-
101
-
102
-
103
-
104
-
105
-
106
-
107
-
108
-
109
-
110
-
111
-
112
-
113
-
114
-
115
-
116
-
117
-
118
-
119
-
120
-
121
-
122
-
123
-
124
-
125
-
126
-
127
-
128
-
129
-
130
-
131
-
132
-
133
-
134
-
135
-
136
-
137
-
138
-
139
-
140
-
141
-
142
-
143
-
144
-
145
-
146
-
147
-
148
-
149
-
150
-
151
-
152
-
153
-
154
-
155
-
156
-
157
-
158
-
159
-
160
-
161
-
162
-
163
-
164
-
165
-
166
-
167
-
168
-
169
-
170
-
171
-
172
-
173
-
174
-
175
-
176
-
177
-
178
-
179
-
180
-
181
-
182
-
183
-
184
-
185
-
186
-
187
-
188
-
189
-
190
-
191
-
192
-
193
-
194
-
195
-
196
-
197
-
198
-
199
-
200
-
201
-
202
-
203
-
204
-
205
-
206
-
207
-
208
-
209
-
210
-
211
-
212
-
213
-
214
-
215
-
216
-
217
-
218
-
219
-
220
-
221
-
222
-
223
-
224
-
225
-
 226
226 -
 227
227 -
 228
228 -
 229
229 -
 230
230 -
 231
231 -
 232
232 -
 233
233 -
 234
234 -
 235
235 -
 236
236 -
 237
237 -
 238
238 -
 239
239 -
 240
240 -
 241
241 -
 242
242 -
 243
243 -
 244
244 -
 245
245 -
 246
246 -
247
-
248
-
249
-
250
-
251
-
252
-
253
-
254
-
255
-
256
-
257
-
258
-
259
-
260
-
261
-
262
-
263
-
264
-
265
-
266
-
267
-
268
-
269
-
270
-
271
-
272
-
273
-
274
-
275
-
276
-
277
-
278
-
279
-
280
-
281
-
282
-
283
-
284
-
285
-
286
-
287
-
288
-
289
-
290
-
291
-
292
-
293
-
294
-
295
-
296
-
297
-
298
-
299
-
300
-
301
-
302
-
303
-
304
-
305
-
306
-
307
-
308
-
309
-
310
-
311
-
312
-
313
-
314
-
315
-
316
-
317
-
318
-
319
-
320
-
321
-
322
-
323
-
324
-
325
-
326
-
327
-
328
-
329
-
330
-
331
-
332
-
333
-
334
-
335
 |
 |
Table of Contents
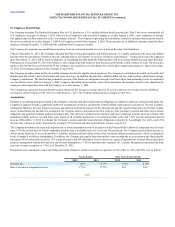
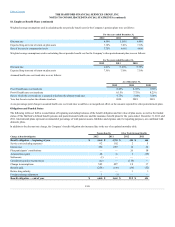
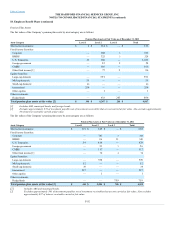
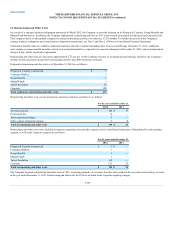
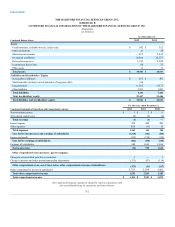
The fair value of the Company’s other postretirement plan assets by asset category are as follows:
Short-term investments $ — $ 14 $ — $ 14
Fixed Income Securities:
Corporate —65 —65
RMBS — 46 — 46
U.S. Treasuries —24 —24
Foreign government — 1 — 1
CMBS —24 —24
Other fixed income — 5 — 5
Equity Securities:
Large-cap — 50 — 50
$ — $ —
[1] Excludes approximately $10 of investment payables net of investment receivables that are not carried at fair value. Also excludes
approximately $1 of interest receivable carried at fair value.
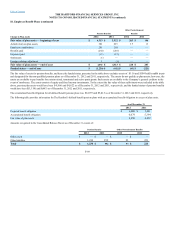
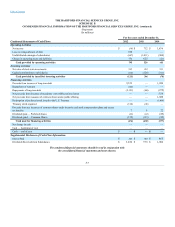
The fair value of the Company’s other postretirement plan assets by asset category are as follows:
Short-term investments $ — $ 9 $ — $ 9
Fixed Income Securities:
Corporate — 53 — 53
RMBS —48 —48
U.S. Treasuries — 28 — 28
Foreign government — 2 — 2
CMBS — 18 — 18
Other fixed income —4—4
Equity Securities:
Large-cap —43 —43
$ — $ —
[1] Excludes approximately $3 of investment payables net of investment receivables that are not carried at fair value. Also excludes
approximately $1 of interest receivable carried at fair value.
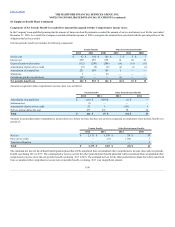
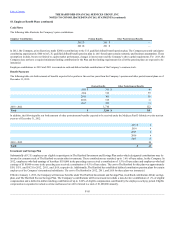
There was no Company common stock included in the other postretirement benefit plan assets as of December 31, 2012 and 2011.
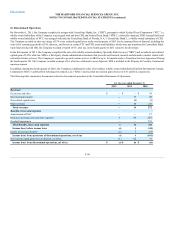
Concentration of Risk
In order to minimize risk, the Plan maintains a listing of permissible and prohibited investments. In addition, the Plan has certain concentration limits and
investment quality requirements imposed on permissible investment options. Permissible investments include U.S. equity, international equity, alternative
asset and fixed income investments including derivative instruments. Derivative instruments include future contracts, options, swaps, currency forwards,
caps or floors and will be used to control risk or enhance return but will not be used for leverage purposes.
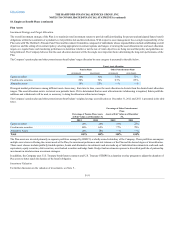
Securities specifically prohibited from purchase include, but are not limited to: shares or fixed income instruments issued by The Hartford, short sales of any
type within long-only portfolios, non-derivative securities involving the use of margin, leveraged floaters and inverse floaters, including money market
obligations, natural resource real properties such as oil, gas or timber and precious metals.
Other than U.S. government and certain U.S. government agencies backed by the full faith and credit of the U.S. government, the Plan does not have any
material exposure to any concentration risk of a single issuer.
F-94