The Hartford 2012 Annual Report Download - page 121
Download and view the complete annual report
Please find page 121 of the 2012 The Hartford annual report below. You can navigate through the pages in the report by either clicking on the pages listed below, or by using the keyword search tool below to find specific information within the annual report.-
 1
1 -
2
-
3
-
4
-
5
-
6
-
7
-
8
-
9
-
10
-
11
-
12
-
13
-
14
-
15
-
16
-
17
-
18
-
19
-
20
-
21
-
22
-
23
-
24
-
25
-
26
-
27
-
28
-
29
-
30
-
31
-
32
-
33
-
34
-
35
-
36
-
37
-
38
-
39
-
40
-
41
-
42
-
43
-
44
-
45
-
46
-
47
-
48
-
49
-
50
-
51
-
52
-
53
-
54
-
55
-
56
-
57
-
58
-
59
-
60
-
61
-
62
-
63
-
64
-
65
-
66
-
67
-
68
-
69
-
70
-
71
-
72
-
73
-
74
-
75
-
76
-
77
-
78
-
79
-
80
-
81
-
82
-
83
-
84
-
85
-
86
-
87
-
88
-
89
-
90
-
91
-
92
-
93
-
94
-
95
-
96
-
97
-
98
-
99
-
100
-
101
-
102
-
103
-
104
-
105
-
106
-
107
-
108
-
109
-
110
-
 111
111 -
 112
112 -
 113
113 -
 114
114 -
 115
115 -
 116
116 -
 117
117 -
 118
118 -
 119
119 -
 120
120 -
 121
121 -
 122
122 -
 123
123 -
 124
124 -
 125
125 -
 126
126 -
 127
127 -
 128
128 -
 129
129 -
 130
130 -
 131
131 -
132
-
133
-
134
-
135
-
136
-
137
-
138
-
139
-
140
-
141
-
142
-
143
-
144
-
145
-
146
-
147
-
148
-
149
-
150
-
151
-
152
-
153
-
154
-
155
-
156
-
157
-
158
-
159
-
160
-
161
-
162
-
163
-
164
-
165
-
166
-
167
-
168
-
169
-
170
-
171
-
172
-
173
-
174
-
175
-
176
-
177
-
178
-
179
-
180
-
181
-
182
-
183
-
184
-
185
-
186
-
187
-
188
-
189
-
190
-
191
-
192
-
193
-
194
-
195
-
196
-
197
-
198
-
199
-
200
-
201
-
202
-
203
-
204
-
205
-
206
-
207
-
208
-
209
-
210
-
211
-
212
-
213
-
214
-
215
-
216
-
217
-
218
-
219
-
220
-
221
-
222
-
223
-
224
-
225
-
226
-
227
-
228
-
229
-
230
-
231
-
232
-
233
-
234
-
235
-
236
-
237
-
238
-
239
-
240
-
241
-
242
-
243
-
244
-
245
-
246
-
247
-
248
-
249
-
250
-
251
-
252
-
253
-
254
-
255
-
256
-
257
-
258
-
259
-
260
-
261
-
262
-
263
-
264
-
265
-
266
-
267
-
268
-
269
-
270
-
271
-
272
-
273
-
274
-
275
-
276
-
277
-
278
-
279
-
280
-
281
-
282
-
283
-
284
-
285
-
286
-
287
-
288
-
289
-
290
-
291
-
292
-
293
-
294
-
295
-
296
-
297
-
298
-
299
-
300
-
301
-
302
-
303
-
304
-
305
-
306
-
307
-
308
-
309
-
310
-
311
-
312
-
313
-
314
-
315
-
316
-
317
-
318
-
319
-
320
-
321
-
322
-
323
-
324
-
325
-
326
-
327
-
328
-
329
-
330
-
331
-
332
-
333
-
334
-
335
 |
 |

Table of Contents
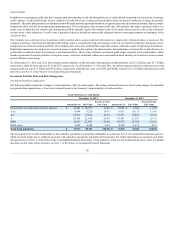
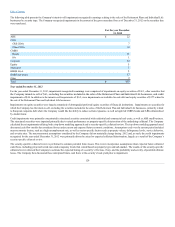
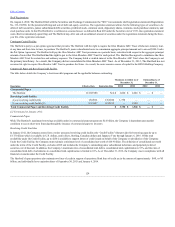
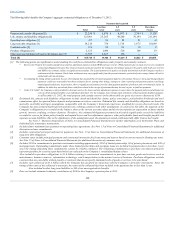
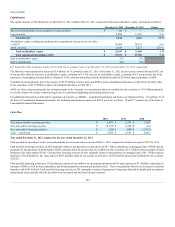
The following table presents the Company's intent-to-sell impairments recognized in earnings relating to the sales of the Retirement Plans and Individual Life
businesses by security type. The Company recognized impairments in the amount of the gross unrealized loss as of December 31, 2012 on the securities that
were transferred.
ABS $ 22
CDO
CRE CDOs 7
Other CDOs 14
CMBS
Bonds 11
IOs 1
Corporate 52
Equity 5
Municipal 1
RMBS Alt-A 5
RMBS sub-prime 57
Other 2
Total
Year ended December 31, 2012
For the year ended December 31, 2012, impairments recognized in earnings were comprised of impairments on equity securities of $ 63, other securities that
the Company intends to sell of $61, excluding the securities included in the sales of the Retirement Plans and Individual Life businesses, and credit
impairments of $48. In addition to the intent-to-sell impairments of $61, were impairments on available-for-sale debt and equity securities of $177 related to
the sale of the Retirement Plans and Individual Life businesses.
Impairments on equity securities were largely comprised of downgraded preferred equity securities of financial institutions. Impairments on securities for
which the Company has the intent-to-sell, excluding the securities included in the sales of the Retirement Plan and Individual Life businesses, primarily related
to European corporate debt where the Company would like the ability to reduce certain exposures, as well as high risk CMBS bonds and ABS collateralized
by student loans.
Credit impairments were primarily concentrated in structured securities associated with residential and commercial real estate, as well as ABS small business.
The structured securities were impaired primarily due to actual performance or property-specific deterioration of the underlying collateral. The Company
calculated these impairments utilizing both a top down modeling approach and a security-specific collateral review. The top down modeling approach used
discounted cash flow models that considered losses under current and expected future economic conditions. Assumptions used over the current period included
macroeconomic factors, such as a high unemployment rate, as well as sector specific factors such as property values, delinquency levels, service behavior,
and severity rates. The macroeconomic assumptions considered by the Company did not materially change during 2012 and, as such, the credit impairments
recognized for the year ended December 31, 2012 were primarily driven by actual or expected collateral deterioration, largely as a result of the Company’s
security-specific collateral review.
The security-specific collateral review is performed to estimate potential future losses. This review incorporates assumptions about expected future collateral
cash flows, including projected rental rates and occupancy levels that varied based on property type and sub-market. The results of the security-specific
collateral review allowed the Company to estimate the expected timing of a security’s first loss, if any, and the probability and severity of potential ultimate
losses. The Company then discounted these anticipated future cash flows at the security’s book yield prior to impairment.
120