The Hartford 2012 Annual Report Download - page 326
Download and view the complete annual report
Please find page 326 of the 2012 The Hartford annual report below. You can navigate through the pages in the report by either clicking on the pages listed below, or by using the keyword search tool below to find specific information within the annual report.-
 1
1 -
2
-
3
-
4
-
5
-
6
-
7
-
8
-
9
-
10
-
11
-
12
-
13
-
14
-
15
-
16
-
17
-
18
-
19
-
20
-
21
-
22
-
23
-
24
-
25
-
26
-
27
-
28
-
29
-
30
-
31
-
32
-
33
-
34
-
35
-
36
-
37
-
38
-
39
-
40
-
41
-
42
-
43
-
44
-
45
-
46
-
47
-
48
-
49
-
50
-
51
-
52
-
53
-
54
-
55
-
56
-
57
-
58
-
59
-
60
-
61
-
62
-
63
-
64
-
65
-
66
-
67
-
68
-
69
-
70
-
71
-
72
-
73
-
74
-
75
-
76
-
77
-
78
-
79
-
80
-
81
-
82
-
83
-
84
-
85
-
86
-
87
-
88
-
89
-
90
-
91
-
92
-
93
-
94
-
95
-
96
-
97
-
98
-
99
-
100
-
101
-
102
-
103
-
104
-
105
-
106
-
107
-
108
-
109
-
110
-
111
-
112
-
113
-
114
-
115
-
116
-
117
-
118
-
119
-
120
-
121
-
122
-
123
-
124
-
125
-
126
-
127
-
128
-
129
-
130
-
131
-
132
-
133
-
134
-
135
-
136
-
137
-
138
-
139
-
140
-
141
-
142
-
143
-
144
-
145
-
146
-
147
-
148
-
149
-
150
-
151
-
152
-
153
-
154
-
155
-
156
-
157
-
158
-
159
-
160
-
161
-
162
-
163
-
164
-
165
-
166
-
167
-
168
-
169
-
170
-
171
-
172
-
173
-
174
-
175
-
176
-
177
-
178
-
179
-
180
-
181
-
182
-
183
-
184
-
185
-
186
-
187
-
188
-
189
-
190
-
191
-
192
-
193
-
194
-
195
-
196
-
197
-
198
-
199
-
200
-
201
-
202
-
203
-
204
-
205
-
206
-
207
-
208
-
209
-
210
-
211
-
212
-
213
-
214
-
215
-
216
-
217
-
218
-
219
-
220
-
221
-
222
-
223
-
224
-
225
-
226
-
227
-
228
-
229
-
230
-
231
-
232
-
233
-
234
-
235
-
236
-
237
-
238
-
239
-
240
-
241
-
242
-
243
-
244
-
245
-
246
-
247
-
248
-
249
-
250
-
251
-
252
-
253
-
254
-
255
-
256
-
257
-
258
-
259
-
260
-
261
-
262
-
263
-
264
-
265
-
266
-
267
-
268
-
269
-
270
-
271
-
272
-
273
-
274
-
275
-
276
-
277
-
278
-
279
-
280
-
281
-
282
-
283
-
284
-
285
-
286
-
287
-
288
-
289
-
290
-
291
-
292
-
293
-
294
-
295
-
296
-
297
-
298
-
299
-
300
-
301
-
302
-
303
-
304
-
305
-
306
-
307
-
308
-
309
-
310
-
311
-
312
-
313
-
314
-
315
-
 316
316 -
 317
317 -
 318
318 -
 319
319 -
 320
320 -
 321
321 -
 322
322 -
 323
323 -
 324
324 -
 325
325 -
 326
326 -
 327
327 -
 328
328 -
 329
329 -
 330
330 -
 331
331 -
 332
332 -
 333
333 -
 334
334 -
 335
335
 |
 |

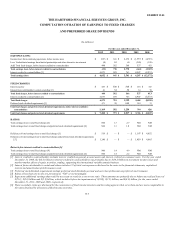
EXHIBIT 12.01
THE HARTFORD FINANCIAL SERVICES GROUP, INC.
COMPUTATION OF RATIOS OF EARNINGS TO FIXED CHARGES
AND PREFERRED SHARE DIVIDENDS
(In millions)
For the years ended December 31,
2012 2011 2010 2009 2008
EARNINGS (LOSS):
Total earnings (loss), before interest credited to contractholders (21)798 2,778 (660)(3,639)
Total earnings (loss) $6,052 $ 987 $ 3,541 $4,287 $(12,172)
FIXED CHARGES:
Total fixed charges, before interest credited to contractholders 498 562 566 537 413
Total fixed charges 6,571 751 1,329 5,484 (8,120)
Total fixed charges and preferred stock dividend requirements, before interest credited to
contractholders 1,169 582 1,254 799 426
Total fixed charges and preferred stock dividend requirements $7,242 $771 $2,017 $5,746 $(8,107)
RATIOS:
[1] Interest credited to contractholders includes interest credited on general account assets and interest credited on consumer notes. For the year ended
December 31, 2008, the $(8.5) billion in interest credited to contractholders was primarily due to $(10.3) billion in investment income losses and
mark-to-market effects of equity securities, trading, supporting the international variable annuity business.
[2] Interest factor attributable to rental and others includes 1/3 of total rent expense as disclosed in the notes to the financial statements, capitalized
interest and amortization of debt issuance costs.
[3] Preferred stock dividend requirements include preferred stock dividends accrued and accretion of discount on preferred stock issuance.
[4] Ratios of less than one-to-one are presented as “NM” or not meaningful.
[5] Represents additional earnings that would be necessary to result in a one-to-one ratio. These amounts are primarily due to before-tax realized losses of
$(711), $(2.0) billion and $(5.9) billion, which includes before-tax impairments of $(349), $(1.5) billion, and $(4.0) billion, for the years ended
December 31, 2012, 2009 and 2008, respectively.
[6] These secondary ratios are disclosed for the convenience of fixed income investors and the rating agencies that serve them and are more comparable to
the ratios disclosed by all issuers of fixed income securities.