The Hartford 2012 Annual Report Download - page 150
Download and view the complete annual report
Please find page 150 of the 2012 The Hartford annual report below. You can navigate through the pages in the report by either clicking on the pages listed below, or by using the keyword search tool below to find specific information within the annual report.-
 1
1 -
2
-
3
-
4
-
5
-
6
-
7
-
8
-
9
-
10
-
11
-
12
-
13
-
14
-
15
-
16
-
17
-
18
-
19
-
20
-
21
-
22
-
23
-
24
-
25
-
26
-
27
-
28
-
29
-
30
-
31
-
32
-
33
-
34
-
35
-
36
-
37
-
38
-
39
-
40
-
41
-
42
-
43
-
44
-
45
-
46
-
47
-
48
-
49
-
50
-
51
-
52
-
53
-
54
-
55
-
56
-
57
-
58
-
59
-
60
-
61
-
62
-
63
-
64
-
65
-
66
-
67
-
68
-
69
-
70
-
71
-
72
-
73
-
74
-
75
-
76
-
77
-
78
-
79
-
80
-
81
-
82
-
83
-
84
-
85
-
86
-
87
-
88
-
89
-
90
-
91
-
92
-
93
-
94
-
95
-
96
-
97
-
98
-
99
-
100
-
101
-
102
-
103
-
104
-
105
-
106
-
107
-
108
-
109
-
110
-
111
-
112
-
113
-
114
-
115
-
116
-
117
-
118
-
119
-
120
-
121
-
122
-
123
-
124
-
125
-
126
-
127
-
128
-
129
-
130
-
131
-
132
-
133
-
134
-
135
-
136
-
137
-
138
-
139
-
 140
140 -
 141
141 -
 142
142 -
 143
143 -
 144
144 -
 145
145 -
 146
146 -
 147
147 -
 148
148 -
 149
149 -
 150
150 -
 151
151 -
 152
152 -
 153
153 -
 154
154 -
 155
155 -
 156
156 -
 157
157 -
 158
158 -
 159
159 -
 160
160 -
161
-
162
-
163
-
164
-
165
-
166
-
167
-
168
-
169
-
170
-
171
-
172
-
173
-
174
-
175
-
176
-
177
-
178
-
179
-
180
-
181
-
182
-
183
-
184
-
185
-
186
-
187
-
188
-
189
-
190
-
191
-
192
-
193
-
194
-
195
-
196
-
197
-
198
-
199
-
200
-
201
-
202
-
203
-
204
-
205
-
206
-
207
-
208
-
209
-
210
-
211
-
212
-
213
-
214
-
215
-
216
-
217
-
218
-
219
-
220
-
221
-
222
-
223
-
224
-
225
-
226
-
227
-
228
-
229
-
230
-
231
-
232
-
233
-
234
-
235
-
236
-
237
-
238
-
239
-
240
-
241
-
242
-
243
-
244
-
245
-
246
-
247
-
248
-
249
-
250
-
251
-
252
-
253
-
254
-
255
-
256
-
257
-
258
-
259
-
260
-
261
-
262
-
263
-
264
-
265
-
266
-
267
-
268
-
269
-
270
-
271
-
272
-
273
-
274
-
275
-
276
-
277
-
278
-
279
-
280
-
281
-
282
-
283
-
284
-
285
-
286
-
287
-
288
-
289
-
290
-
291
-
292
-
293
-
294
-
295
-
296
-
297
-
298
-
299
-
300
-
301
-
302
-
303
-
304
-
305
-
306
-
307
-
308
-
309
-
310
-
311
-
312
-
313
-
314
-
315
-
316
-
317
-
318
-
319
-
320
-
321
-
322
-
323
-
324
-
325
-
326
-
327
-
328
-
329
-
330
-
331
-
332
-
333
-
334
-
335
 |
 |
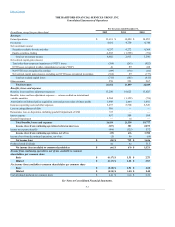
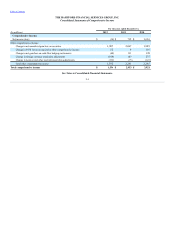
Amortization of deferred policy acquisition costs and present value of future profits $3,427 $(983) $ 2,444
Insurance operating costs and other expenses $ 4,398 $ 912 $ 5,310
Income from continuing operations before income taxes $230 $ 71 $ 301
Income tax expense (benefit) $(346) $ 21 $ (325)
Net income $662 $ 50 $ 712
Net income available to common shareholders $ 620 $ 50 $ 670
Income from continuing operations, net of tax, available to common shareholders per common
share:
Basic $1.20 $0.11 $1.31
Diluted $ 1.12 $ 0.10 $ 1.22
Net income available to common shareholders per common share:
Basic $ 1.39 $ 0.12 $1.51
Diluted $1.30 $0.10 $1.40
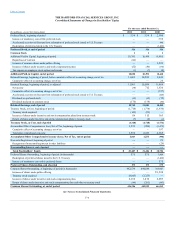
Amortization of deferred policy acquisition costs and present value of future profits $2,527 $(835) $ 1,692
Insurance operating costs and other expenses $4,407 $919 $5,326
Income from continuing operations before income taxes $2,356 $(84) $ 2,272
Income tax expense (benefit) $612 $(40) $ 572
Net income $1,680 $(44) $ 1,636
Net income available to common shareholders $1,165 $(44) $ 1,121
Income from continuing operations, net of tax, available to common shareholders per common
share:
Basic $2.85 $(0.10) $ 2.75
Diluted $2.62 $(0.09) $ 2.53
Net income available to common shareholders per common share:
Basic $2.70 $(0.10) $ 2.60
Diluted $ 2.49 $ (0.09) $ 2.40
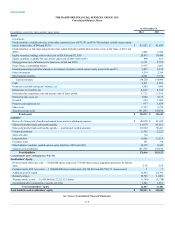
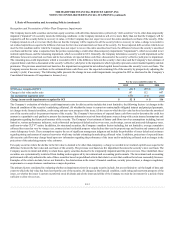
The Consolidated Financial Statements include the accounts of The Hartford Financial Services Group, Inc., companies in which the Company directly or
indirectly has a controlling financial interest and those variable interest entities (“VIEs”) in which the Company is required to consolidate. Entities in which the
Company has significant influence over the operating and financing decisions but are not required to consolidate are reported using the equity method. For
further discussions on VIEs see Note 6 of the Notes to Consolidated Financial Statements. Material intercompany transactions and balances between The
Hartford and its subsidiaries and affiliates have been eliminated.
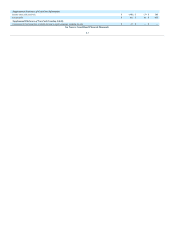
The results of operations of a component of the Company that either has been disposed of or is classified as held-for-sale are reported in discontinued
operations if the operations and cash flows of the component have been or will be eliminated from the ongoing operations of the Company as a result of the
disposal transaction and the Company will not have any significant continuing involvement in the operations of the component after the disposal transaction.
The Company is presenting the operations of certain businesses that meet the criteria for reporting as discontinued operations. Amounts for prior periods have
been retrospectively reclassified. See Note 20 of the Notes to Consolidated Financial Statements for information on the specific subsidiaries and related
impacts.
F-9