The Hartford 2012 Annual Report Download - page 103
Download and view the complete annual report
Please find page 103 of the 2012 The Hartford annual report below. You can navigate through the pages in the report by either clicking on the pages listed below, or by using the keyword search tool below to find specific information within the annual report.-
 1
1 -
2
-
3
-
4
-
5
-
6
-
7
-
8
-
9
-
10
-
11
-
12
-
13
-
14
-
15
-
16
-
17
-
18
-
19
-
20
-
21
-
22
-
23
-
24
-
25
-
26
-
27
-
28
-
29
-
30
-
31
-
32
-
33
-
34
-
35
-
36
-
37
-
38
-
39
-
40
-
41
-
42
-
43
-
44
-
45
-
46
-
47
-
48
-
49
-
50
-
51
-
52
-
53
-
54
-
55
-
56
-
57
-
58
-
59
-
60
-
61
-
62
-
63
-
64
-
65
-
66
-
67
-
68
-
69
-
70
-
71
-
72
-
73
-
74
-
75
-
76
-
77
-
78
-
79
-
80
-
81
-
82
-
83
-
84
-
85
-
86
-
87
-
88
-
89
-
90
-
91
-
92
-
 93
93 -
 94
94 -
 95
95 -
 96
96 -
 97
97 -
 98
98 -
 99
99 -
 100
100 -
 101
101 -
 102
102 -
 103
103 -
 104
104 -
 105
105 -
 106
106 -
 107
107 -
 108
108 -
 109
109 -
 110
110 -
 111
111 -
 112
112 -
 113
113 -
114
-
115
-
116
-
117
-
118
-
119
-
120
-
121
-
122
-
123
-
124
-
125
-
126
-
127
-
128
-
129
-
130
-
131
-
132
-
133
-
134
-
135
-
136
-
137
-
138
-
139
-
140
-
141
-
142
-
143
-
144
-
145
-
146
-
147
-
148
-
149
-
150
-
151
-
152
-
153
-
154
-
155
-
156
-
157
-
158
-
159
-
160
-
161
-
162
-
163
-
164
-
165
-
166
-
167
-
168
-
169
-
170
-
171
-
172
-
173
-
174
-
175
-
176
-
177
-
178
-
179
-
180
-
181
-
182
-
183
-
184
-
185
-
186
-
187
-
188
-
189
-
190
-
191
-
192
-
193
-
194
-
195
-
196
-
197
-
198
-
199
-
200
-
201
-
202
-
203
-
204
-
205
-
206
-
207
-
208
-
209
-
210
-
211
-
212
-
213
-
214
-
215
-
216
-
217
-
218
-
219
-
220
-
221
-
222
-
223
-
224
-
225
-
226
-
227
-
228
-
229
-
230
-
231
-
232
-
233
-
234
-
235
-
236
-
237
-
238
-
239
-
240
-
241
-
242
-
243
-
244
-
245
-
246
-
247
-
248
-
249
-
250
-
251
-
252
-
253
-
254
-
255
-
256
-
257
-
258
-
259
-
260
-
261
-
262
-
263
-
264
-
265
-
266
-
267
-
268
-
269
-
270
-
271
-
272
-
273
-
274
-
275
-
276
-
277
-
278
-
279
-
280
-
281
-
282
-
283
-
284
-
285
-
286
-
287
-
288
-
289
-
290
-
291
-
292
-
293
-
294
-
295
-
296
-
297
-
298
-
299
-
300
-
301
-
302
-
303
-
304
-
305
-
306
-
307
-
308
-
309
-
310
-
311
-
312
-
313
-
314
-
315
-
316
-
317
-
318
-
319
-
320
-
321
-
322
-
323
-
324
-
325
-
326
-
327
-
328
-
329
-
330
-
331
-
332
-
333
-
334
-
335
 |
 |
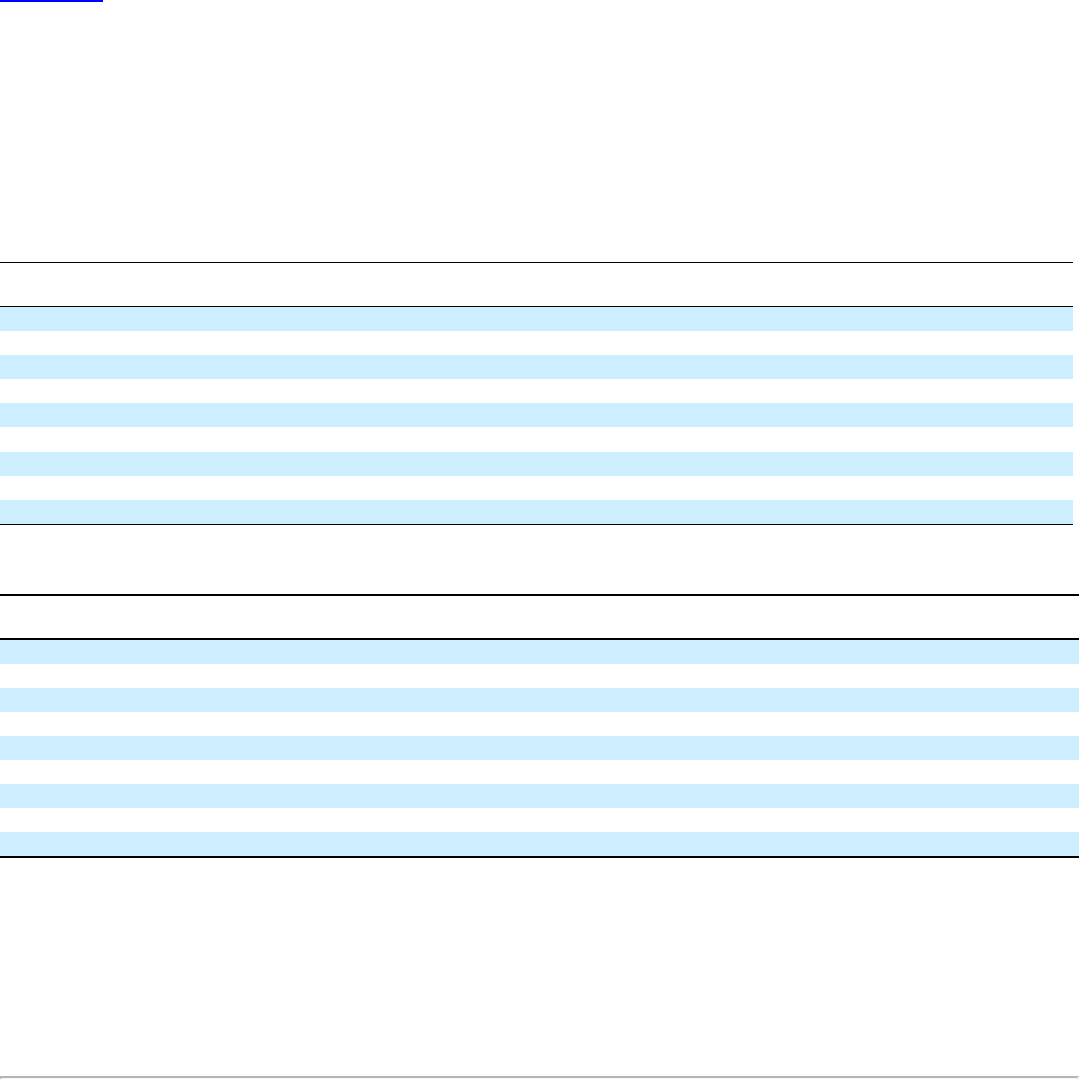
Table of Contents
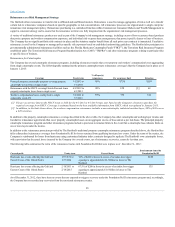
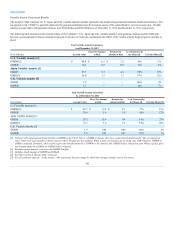
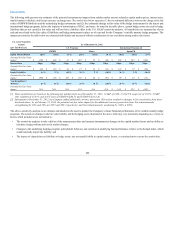
Variable Annuity Guaranteed Benefits
The majority of the Company’s U.S., Japan, and U.K. variable annuities include optional living benefit and guaranteed minimum death benefit features. The
net amount at risk (“NAR”) is generally defined as the guaranteed minimum benefit amount in excess of the contractholder’s current account value. Variable
annuity account values with guarantee features were $94.4 billion and $99.8 billion as of December 31, 2012 and December 31, 2011, respectively.
The following table summarizes the account values of the Company’s U.S., Japan and U.K. variable annuities with guarantee features and the NAR split
between various guarantee features (retained net amount at risk does not take into consideration the effects of the variable annuity hedge programs currently in
place):
($ in billions)
GMDB [2] $ 64.8 $ 6.6 $ 2.2 48%13%
GMWB 34.2 0.7 0.5 23%9%
GMDB 27.7 5.7 4.8 98%18%
GMIB [3] 26.0 3.3 3.3 97%12%
GMDB 1.9 — — 100%2%
GMWB 1.7 — — 24%7%
($ in billions)
U. S Variable Annuity [1]
GMDB [2] $68.7 $12.0 $5.1 77%15%
GMWB 36.6 1.9 1.6 45%12%
Japan Variable Annuity [1]
GMDB 29.2 10.9 9.4 99%27%
GMIB [3] 27.3 7.5 7.5 99%22%
U.K. Variable Annuity [1]
GMDB 1.9 0.08 0.08 100%4%
GMWB 1.8 0.07 0.07 57%3%
[1] Policies with a guaranteed living benefit (a GMWB in the US or UK, or a GMIB in Japan) also have a guaranteed death benefit. The net amount at
risk (“NAR”) for each benefit is shown; however these benefits are not additive. When a policy terminates due to death, any NAR related to GMWB or
GMIB is released. Similarly, when a policy goes into benefit status on a GMWB or, by contract, the GMDB NAR is reduced to zero. When a policy goes
into benefit status on a GMIB, its GMDB NAR is released.
[2] Excludes group annuity contracts with GMDB benefits.
[3] Includes small amount of GMWB and GMAB.
[4] Excludes contracts that are fully reinsured.
[5] For all contracts that are “in the money”, this represents the percentage by which the average contract was in the money.
102