The Hartford 2012 Annual Report Download - page 183
Download and view the complete annual report
Please find page 183 of the 2012 The Hartford annual report below. You can navigate through the pages in the report by either clicking on the pages listed below, or by using the keyword search tool below to find specific information within the annual report.-
 1
1 -
2
-
3
-
4
-
5
-
6
-
7
-
8
-
9
-
10
-
11
-
12
-
13
-
14
-
15
-
16
-
17
-
18
-
19
-
20
-
21
-
22
-
23
-
24
-
25
-
26
-
27
-
28
-
29
-
30
-
31
-
32
-
33
-
34
-
35
-
36
-
37
-
38
-
39
-
40
-
41
-
42
-
43
-
44
-
45
-
46
-
47
-
48
-
49
-
50
-
51
-
52
-
53
-
54
-
55
-
56
-
57
-
58
-
59
-
60
-
61
-
62
-
63
-
64
-
65
-
66
-
67
-
68
-
69
-
70
-
71
-
72
-
73
-
74
-
75
-
76
-
77
-
78
-
79
-
80
-
81
-
82
-
83
-
84
-
85
-
86
-
87
-
88
-
89
-
90
-
91
-
92
-
93
-
94
-
95
-
96
-
97
-
98
-
99
-
100
-
101
-
102
-
103
-
104
-
105
-
106
-
107
-
108
-
109
-
110
-
111
-
112
-
113
-
114
-
115
-
116
-
117
-
118
-
119
-
120
-
121
-
122
-
123
-
124
-
125
-
126
-
127
-
128
-
129
-
130
-
131
-
132
-
133
-
134
-
135
-
136
-
137
-
138
-
139
-
140
-
141
-
142
-
143
-
144
-
145
-
146
-
147
-
148
-
149
-
150
-
151
-
152
-
153
-
154
-
155
-
156
-
157
-
158
-
159
-
160
-
161
-
162
-
163
-
164
-
165
-
166
-
167
-
168
-
169
-
170
-
171
-
172
-
 173
173 -
 174
174 -
 175
175 -
 176
176 -
 177
177 -
 178
178 -
 179
179 -
 180
180 -
 181
181 -
 182
182 -
 183
183 -
 184
184 -
 185
185 -
 186
186 -
 187
187 -
 188
188 -
 189
189 -
 190
190 -
 191
191 -
 192
192 -
 193
193 -
194
-
195
-
196
-
197
-
198
-
199
-
200
-
201
-
202
-
203
-
204
-
205
-
206
-
207
-
208
-
209
-
210
-
211
-
212
-
213
-
214
-
215
-
216
-
217
-
218
-
219
-
220
-
221
-
222
-
223
-
224
-
225
-
226
-
227
-
228
-
229
-
230
-
231
-
232
-
233
-
234
-
235
-
236
-
237
-
238
-
239
-
240
-
241
-
242
-
243
-
244
-
245
-
246
-
247
-
248
-
249
-
250
-
251
-
252
-
253
-
254
-
255
-
256
-
257
-
258
-
259
-
260
-
261
-
262
-
263
-
264
-
265
-
266
-
267
-
268
-
269
-
270
-
271
-
272
-
273
-
274
-
275
-
276
-
277
-
278
-
279
-
280
-
281
-
282
-
283
-
284
-
285
-
286
-
287
-
288
-
289
-
290
-
291
-
292
-
293
-
294
-
295
-
296
-
297
-
298
-
299
-
300
-
301
-
302
-
303
-
304
-
305
-
306
-
307
-
308
-
309
-
310
-
311
-
312
-
313
-
314
-
315
-
316
-
317
-
318
-
319
-
320
-
321
-
322
-
323
-
324
-
325
-
326
-
327
-
328
-
329
-
330
-
331
-
332
-
333
-
334
-
335
 |
 |
Table of Contents
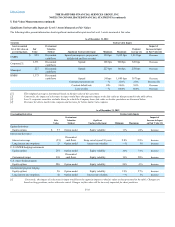
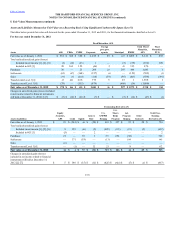
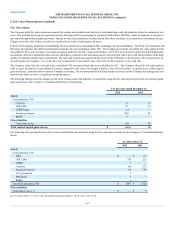
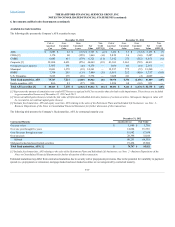
Fair value as of January 1, 2011 $477 $2,581 $689 $2,129 $56 $ 272 $ 1,285 $7,489 $522
Total realized/unrealized gains (losses)
Included in net income [1], [2], [6] (27)(41)11 (40) — — (21)(118) 22
Included in OCI [3] 22 126 52 (31) 1 48 3221 —
Purchases 58 —29 108 3131 25 354 —
Settlements (37) (151) (86) (121)(4) — (135)(534)(3)
Sales (10)(66)(317) (162) (7)(2) (16) (580)(42)
Transfers into Level 3 [4] 82 30 268 774 39 482 1,279 —
Transfers out of Level 3 [4] (204)(2,111) (58) (402)(39) (16) (160)(2,990)(4)
Changes in unrealized gains (losses) included
in net income related to financial instruments
still held at December 31, 2011 [2] [7] $ (16) $ (41) $ (17) $ (17) $ — $ — $ (15) $ (106) $ 19
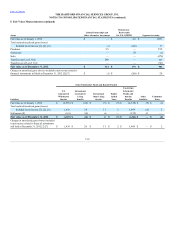
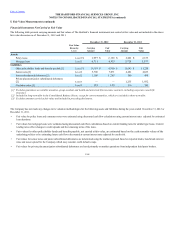
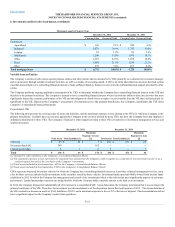
Fair value as of January 1, 2011 $ 154 $ (390) $ 4$(53) $ 600 $203 $ 5 $ 32 $401
Total realized/unrealized gains (losses)
Included in net income [1], [2], [6] (12)(170) (9) (21)279 (128)(3)(4)(56)
Included in OCI [3] (4) — — — — — — — —
Purchases 39 1 45 64 23 347 33 — 513
Settlements —(2) — (48) (19) (65) — — (134)
Sales (10) — — — — — — — —
Transfers into Level 3 [4] 7 — — — — — — — —
Transfers out of Level 3 [4] (81) — — — — — — — —
Changes in unrealized gains (losses)
included in net income related to financial
instruments still held at December 31,
2011 [2] [7] $(10) $ (163) $ (8) $ (19) $ 278 $ (107) $ (5) $ (4) $ (28)
F-41