The Hartford 2012 Annual Report Download - page 194
Download and view the complete annual report
Please find page 194 of the 2012 The Hartford annual report below. You can navigate through the pages in the report by either clicking on the pages listed below, or by using the keyword search tool below to find specific information within the annual report.-
 1
1 -
2
-
3
-
4
-
5
-
6
-
7
-
8
-
9
-
10
-
11
-
12
-
13
-
14
-
15
-
16
-
17
-
18
-
19
-
20
-
21
-
22
-
23
-
24
-
25
-
26
-
27
-
28
-
29
-
30
-
31
-
32
-
33
-
34
-
35
-
36
-
37
-
38
-
39
-
40
-
41
-
42
-
43
-
44
-
45
-
46
-
47
-
48
-
49
-
50
-
51
-
52
-
53
-
54
-
55
-
56
-
57
-
58
-
59
-
60
-
61
-
62
-
63
-
64
-
65
-
66
-
67
-
68
-
69
-
70
-
71
-
72
-
73
-
74
-
75
-
76
-
77
-
78
-
79
-
80
-
81
-
82
-
83
-
84
-
85
-
86
-
87
-
88
-
89
-
90
-
91
-
92
-
93
-
94
-
95
-
96
-
97
-
98
-
99
-
100
-
101
-
102
-
103
-
104
-
105
-
106
-
107
-
108
-
109
-
110
-
111
-
112
-
113
-
114
-
115
-
116
-
117
-
118
-
119
-
120
-
121
-
122
-
123
-
124
-
125
-
126
-
127
-
128
-
129
-
130
-
131
-
132
-
133
-
134
-
135
-
136
-
137
-
138
-
139
-
140
-
141
-
142
-
143
-
144
-
145
-
146
-
147
-
148
-
149
-
150
-
151
-
152
-
153
-
154
-
155
-
156
-
157
-
158
-
159
-
160
-
161
-
162
-
163
-
164
-
165
-
166
-
167
-
168
-
169
-
170
-
171
-
172
-
173
-
174
-
175
-
176
-
177
-
178
-
179
-
180
-
181
-
182
-
183
-
 184
184 -
 185
185 -
 186
186 -
 187
187 -
 188
188 -
 189
189 -
 190
190 -
 191
191 -
 192
192 -
 193
193 -
 194
194 -
 195
195 -
 196
196 -
 197
197 -
 198
198 -
 199
199 -
 200
200 -
 201
201 -
 202
202 -
 203
203 -
 204
204 -
205
-
206
-
207
-
208
-
209
-
210
-
211
-
212
-
213
-
214
-
215
-
216
-
217
-
218
-
219
-
220
-
221
-
222
-
223
-
224
-
225
-
226
-
227
-
228
-
229
-
230
-
231
-
232
-
233
-
234
-
235
-
236
-
237
-
238
-
239
-
240
-
241
-
242
-
243
-
244
-
245
-
246
-
247
-
248
-
249
-
250
-
251
-
252
-
253
-
254
-
255
-
256
-
257
-
258
-
259
-
260
-
261
-
262
-
263
-
264
-
265
-
266
-
267
-
268
-
269
-
270
-
271
-
272
-
273
-
274
-
275
-
276
-
277
-
278
-
279
-
280
-
281
-
282
-
283
-
284
-
285
-
286
-
287
-
288
-
289
-
290
-
291
-
292
-
293
-
294
-
295
-
296
-
297
-
298
-
299
-
300
-
301
-
302
-
303
-
304
-
305
-
306
-
307
-
308
-
309
-
310
-
311
-
312
-
313
-
314
-
315
-
316
-
317
-
318
-
319
-
320
-
321
-
322
-
323
-
324
-
325
-
326
-
327
-
328
-
329
-
330
-
331
-
332
-
333
-
334
-
335
 |
 |

Table of Contents
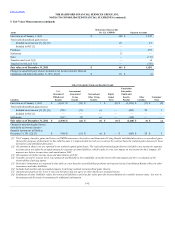
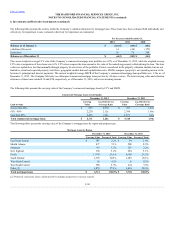
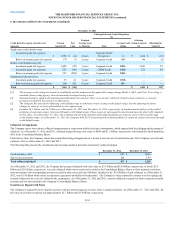
Non-Consolidated VIEs
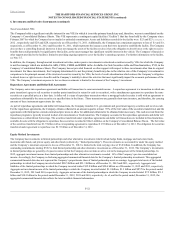
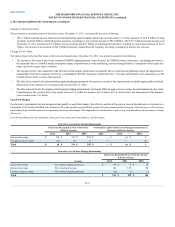
The Company holds a significant variable interest for one VIE for which it is not the primary beneficiary and, therefore, was not consolidated on the
Company’s Consolidated Balance Sheets. This VIE represents a contingent capital facility (“facility”) that has been held by the Company since
February 2007 for which the Company has no implied or unfunded commitments. Assets and liabilities recorded for the facility were $23 and $23 as of December 31,
2012 , respectively and $28 and $28, respectively as of December 31, 2011. Additionally, the Company has a maximum exposure to loss of $3 and $3,
respectively, as of December 31, 2012 and December 31, 2011, which represents the issuance costs that were incurred to establish the facility. The Company
does not have a controlling financial interest as it does not manage the assets of the facility nor does it have the obligation to absorb losses or the right to receive
benefits that could potentially be significant to the facility, as the asset manager has significant variable interest in the vehicle. The Company’s financial or
other support provided to the facility is limited to providing ongoing support to cover the facility’s operating expenses. For further information on the facility,
see Note 15.
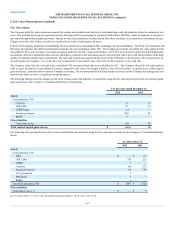
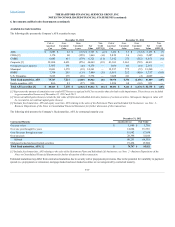
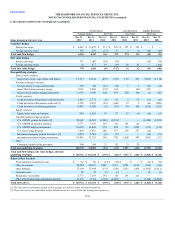
In addition, the Company, through normal investment activities, makes passive investments in structured securities issued by VIEs for which the Company
is not the manager which are included in ABS, CDOs, CMBS and RMBS in the Available-for-Sale Securities table and fixed maturities, FVO, in the
Company’s Consolidated Balance Sheets. The Company has not provided financial or other support with respect to these investments other than its original
investment. For these investments, the Company determined it is not the primary beneficiary due to the relative size of the Company’s investment in
comparison to the principal amount of the structured securities issued by the VIEs, the level of credit subordination which reduces the Company’s obligation
to absorb losses or right to receive benefits and the Company’s inability to direct the activities that most significantly impact the economic performance of the
VIEs. The Company’s maximum exposure to loss on these investments is limited to the amount of the Company’s investment.
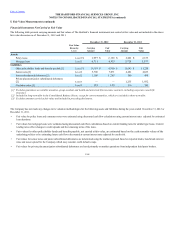
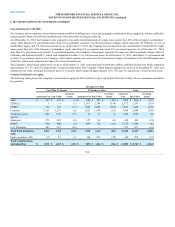
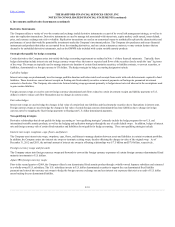
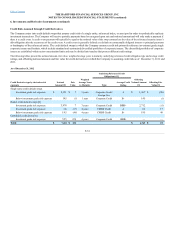
The Company enters into repurchase agreements and dollar roll transactions to earn incremental income. A repurchase agreement is a transaction in which one
party (transferor) agrees to sell securities to another party (transferee) in return for cash (or securities), with a simultaneous agreement to repurchase the same
securities at a specified price at a later date. A dollar roll is a type of repurchase transaction where a mortgage backed security is sold with an agreement to
repurchase substantially the same security at a specified time in the future. These transactions are generally short-term in nature, and therefore, the carrying
amounts of these instruments approximate fair value.
As part of repurchase agreements and dollar roll transactions, the Company transfers U.S. government and government agency securities and receives cash.
For the repurchase agreements, the Company obtains collateral in an amount equal to at least 95% of the fair value of the securities transferred, and the
agreements with third parties contain contractual provisions to allow for additional collateral to be obtained when necessary. The cash received from the
repurchase program is typically invested in short-term investments or fixed maturities. The Company accounts for the repurchase agreements and dollar roll
transactions as collateralized borrowings. The securities transferred under repurchase agreements and dollar roll transactions are included in fixed maturities,
available-for-sale with the obligation to repurchase those securities recorded in Other Liabilities on the Company's Consolidated Balance Sheets. The fair value
of the securities transferred was $1.9 billion with a corresponding agreement to repurchase $ 1.9 billion as of December 31, 2012. The obligation for securities
transferred under agreement to repurchase was $1.9 billion as of December 31, 2012.
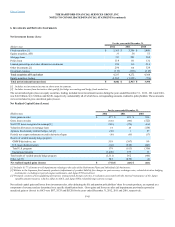
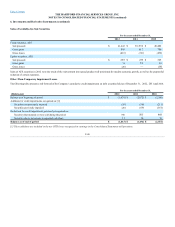
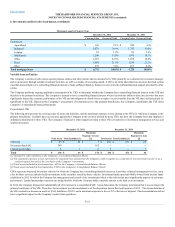
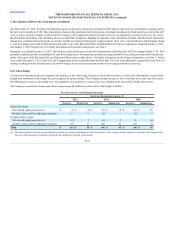
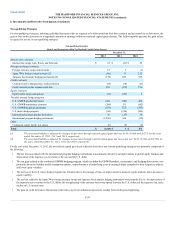
The Company has investments in limited partnerships and other alternative investments which include hedge funds, mortgage and real estate funds,
mezzanine debt funds, and private equity and other funds (collectively, “limited partnerships”). These investments are accounted for under the equity method
and the Company’s maximum exposure to loss as of December 31, 2012 is limited to the total carrying value of $3.0 billion. In addition, the Company has
outstanding commitments totaling $562 to fund limited partnership and other alternative investments as of December 31, 2012. The Company’s investments
in limited partnerships are generally of a passive nature in that the Company does not take an active role in the management of the limited partnerships. In
2012, aggregate investment income from limited partnerships and other alternative investments exceeded 10% of the Company’s pre-tax consolidated net
income. Accordingly, the Company is disclosing aggregated summarized financial data for the Company’s limited partnership investments. This aggregated
summarized financial data does not represent the Company’s proportionate share of limited partnership assets or earnings. Aggregate total assets of the limited
partnerships in which the Company invested totaled $90.5 billion and $91.3 billion as of December 31, 2012 and 2011, respectively. Aggregate total
liabilities of the limited partnerships in which the Company invested totaled $12.8 billion and $20.6 billion as of December 31, 2012 and 2011, respectively.
Aggregate net investment income of the limited partnerships in which the Company invested totaled $1.0 billion, $1.3 billion and $857 for the periods ended
December 31, 2012, 2011 and 2010, respectively. Aggregate net income of the limited partnerships in which the Company invested totaled $7.2 billion, $9.1
billion and $10.3 billion for the periods ended December 31, 2012, 2011 and 2010, respectively. As of, and for the period ended, December 31, 2012, the
aggregated summarized financial data reflects the latest available financial information.
F-52