The Hartford 2012 Annual Report Download - page 62
Download and view the complete annual report
Please find page 62 of the 2012 The Hartford annual report below. You can navigate through the pages in the report by either clicking on the pages listed below, or by using the keyword search tool below to find specific information within the annual report.-
 1
1 -
2
-
3
-
4
-
5
-
6
-
7
-
8
-
9
-
10
-
11
-
12
-
13
-
14
-
15
-
16
-
17
-
18
-
19
-
20
-
21
-
22
-
23
-
24
-
25
-
26
-
27
-
28
-
29
-
30
-
31
-
32
-
33
-
34
-
35
-
36
-
37
-
38
-
39
-
40
-
41
-
42
-
43
-
44
-
45
-
46
-
47
-
48
-
49
-
50
-
51
-
 52
52 -
 53
53 -
 54
54 -
 55
55 -
 56
56 -
 57
57 -
 58
58 -
 59
59 -
 60
60 -
 61
61 -
 62
62 -
 63
63 -
 64
64 -
 65
65 -
 66
66 -
 67
67 -
 68
68 -
 69
69 -
 70
70 -
 71
71 -
 72
72 -
73
-
74
-
75
-
76
-
77
-
78
-
79
-
80
-
81
-
82
-
83
-
84
-
85
-
86
-
87
-
88
-
89
-
90
-
91
-
92
-
93
-
94
-
95
-
96
-
97
-
98
-
99
-
100
-
101
-
102
-
103
-
104
-
105
-
106
-
107
-
108
-
109
-
110
-
111
-
112
-
113
-
114
-
115
-
116
-
117
-
118
-
119
-
120
-
121
-
122
-
123
-
124
-
125
-
126
-
127
-
128
-
129
-
130
-
131
-
132
-
133
-
134
-
135
-
136
-
137
-
138
-
139
-
140
-
141
-
142
-
143
-
144
-
145
-
146
-
147
-
148
-
149
-
150
-
151
-
152
-
153
-
154
-
155
-
156
-
157
-
158
-
159
-
160
-
161
-
162
-
163
-
164
-
165
-
166
-
167
-
168
-
169
-
170
-
171
-
172
-
173
-
174
-
175
-
176
-
177
-
178
-
179
-
180
-
181
-
182
-
183
-
184
-
185
-
186
-
187
-
188
-
189
-
190
-
191
-
192
-
193
-
194
-
195
-
196
-
197
-
198
-
199
-
200
-
201
-
202
-
203
-
204
-
205
-
206
-
207
-
208
-
209
-
210
-
211
-
212
-
213
-
214
-
215
-
216
-
217
-
218
-
219
-
220
-
221
-
222
-
223
-
224
-
225
-
226
-
227
-
228
-
229
-
230
-
231
-
232
-
233
-
234
-
235
-
236
-
237
-
238
-
239
-
240
-
241
-
242
-
243
-
244
-
245
-
246
-
247
-
248
-
249
-
250
-
251
-
252
-
253
-
254
-
255
-
256
-
257
-
258
-
259
-
260
-
261
-
262
-
263
-
264
-
265
-
266
-
267
-
268
-
269
-
270
-
271
-
272
-
273
-
274
-
275
-
276
-
277
-
278
-
279
-
280
-
281
-
282
-
283
-
284
-
285
-
286
-
287
-
288
-
289
-
290
-
291
-
292
-
293
-
294
-
295
-
296
-
297
-
298
-
299
-
300
-
301
-
302
-
303
-
304
-
305
-
306
-
307
-
308
-
309
-
310
-
311
-
312
-
313
-
314
-
315
-
316
-
317
-
318
-
319
-
320
-
321
-
322
-
323
-
324
-
325
-
326
-
327
-
328
-
329
-
330
-
331
-
332
-
333
-
334
-
335
 |
 |

Table of Contents
Estimated Gross Profits Used in the Valuation and Amortization of Assets and Liabilities Associated with Variable Annuity and Other Universal
Life-Type Contracts
Estimated gross profits are used in the amortization of: the deferred policy acquisition costs ("DAC") asset, which includes the present value of future profits;
sales inducement assets (“SIA”); and unearned revenue reserves (“URR”). See Note 1, Note 2 and Note 8 of the Notes to Consolidated Financial Statements
for additional information on DAC. See Note 11 of the Notes to Consolidated Financial Statements for additional information on SIA. Portions of EGPs are
also used in the valuation of reserves for death and other insurance benefit features on variable annuity and universal life-type contracts. See Note 10 of the
Notes to Consolidated Financial Statements for additional information on death and other insurance benefit reserves.
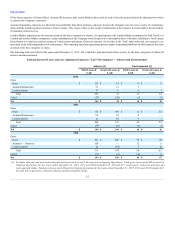
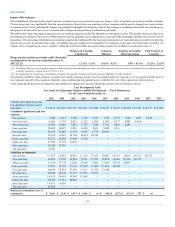
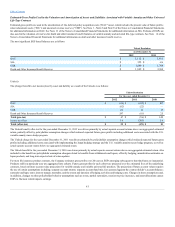
The most significant EGP based balances are as follows:
DAC $5,112 $5,931
SIA $ 325 $ 434
URR $ 1,880 $ 1,708
Death and Other Insurance Benefit Reserves $1,942 $2,308
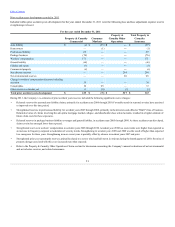
Unlocks
The (charge) benefit to net income (loss) by asset and liability as a result of the Unlocks is as follows:
DAC $(144) $ (419) $ 107
SIA (82)(22) —
URR 26 40 17
Death and Other Insurance Benefit Reserves 247 (333)25
$47 $(734) $ 149
Income tax effect 16 (261) 56
The Unlock benefit, after-tax for the year ended December 31, 2012 was driven primarily by actual separate account returns above our aggregated estimated
return, partially offset by policyholder assumption changes which reduced expected future gross profits including additional costs associated with the U.S.
variable annuity macro hedge program.
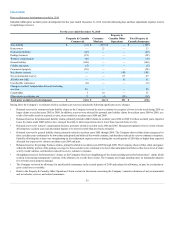
The Unlock charge for the year ended December 31, 2011 was driven primarily by policyholder assumption changes which reduced expected future gross
profits including additional costs associated with implementing the Japan hedging strategy and the U.S. variable annuity macro hedge program, as well as
actual separate account returns below our aggregated estimated return.
The Unlock benefit for the year ended December 31, 2010 was driven primarily by actual separate account returns above our aggregated estimated return. Also
included in the benefit are policyholder assumption changes related to benefits from withdrawals and lapses, offset by hedging, annuitization estimates on
Japan products, and long-term expected rate of return updates.
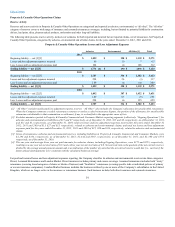
For most life insurance product contracts, the Company estimates gross profits over 20 years as EGPs emerging subsequent to that timeframe are immaterial.
Products sold in a particular year are aggregated into cohorts. Future gross profits for each cohort are projected over the estimated lives of the underlying
contracts, based on future account value projections for variable annuity and variable universal life products. The projection of future account values requires
the use of certain assumptions including: separate account returns; separate account fund mix; fees assessed against the contract holder’s account balance;
surrender and lapse rates; interest margin; mortality; and the extent and duration of hedging activities and hedging costs. Changes in these assumptions and,
in addition, changes to other policyholder behavior assumptions such as resets, partial surrenders, reaction to price increases, and asset allocations causes
EGPs to fluctuate which impacts earnings.
61