The Hartford 2012 Annual Report Download - page 113
Download and view the complete annual report
Please find page 113 of the 2012 The Hartford annual report below. You can navigate through the pages in the report by either clicking on the pages listed below, or by using the keyword search tool below to find specific information within the annual report.-
 1
1 -
2
-
3
-
4
-
5
-
6
-
7
-
8
-
9
-
10
-
11
-
12
-
13
-
14
-
15
-
16
-
17
-
18
-
19
-
20
-
21
-
22
-
23
-
24
-
25
-
26
-
27
-
28
-
29
-
30
-
31
-
32
-
33
-
34
-
35
-
36
-
37
-
38
-
39
-
40
-
41
-
42
-
43
-
44
-
45
-
46
-
47
-
48
-
49
-
50
-
51
-
52
-
53
-
54
-
55
-
56
-
57
-
58
-
59
-
60
-
61
-
62
-
63
-
64
-
65
-
66
-
67
-
68
-
69
-
70
-
71
-
72
-
73
-
74
-
75
-
76
-
77
-
78
-
79
-
80
-
81
-
82
-
83
-
84
-
85
-
86
-
87
-
88
-
89
-
90
-
91
-
92
-
93
-
94
-
95
-
96
-
97
-
98
-
99
-
100
-
101
-
102
-
 103
103 -
 104
104 -
 105
105 -
 106
106 -
 107
107 -
 108
108 -
 109
109 -
 110
110 -
 111
111 -
 112
112 -
 113
113 -
 114
114 -
 115
115 -
 116
116 -
 117
117 -
 118
118 -
 119
119 -
 120
120 -
 121
121 -
 122
122 -
 123
123 -
124
-
125
-
126
-
127
-
128
-
129
-
130
-
131
-
132
-
133
-
134
-
135
-
136
-
137
-
138
-
139
-
140
-
141
-
142
-
143
-
144
-
145
-
146
-
147
-
148
-
149
-
150
-
151
-
152
-
153
-
154
-
155
-
156
-
157
-
158
-
159
-
160
-
161
-
162
-
163
-
164
-
165
-
166
-
167
-
168
-
169
-
170
-
171
-
172
-
173
-
174
-
175
-
176
-
177
-
178
-
179
-
180
-
181
-
182
-
183
-
184
-
185
-
186
-
187
-
188
-
189
-
190
-
191
-
192
-
193
-
194
-
195
-
196
-
197
-
198
-
199
-
200
-
201
-
202
-
203
-
204
-
205
-
206
-
207
-
208
-
209
-
210
-
211
-
212
-
213
-
214
-
215
-
216
-
217
-
218
-
219
-
220
-
221
-
222
-
223
-
224
-
225
-
226
-
227
-
228
-
229
-
230
-
231
-
232
-
233
-
234
-
235
-
236
-
237
-
238
-
239
-
240
-
241
-
242
-
243
-
244
-
245
-
246
-
247
-
248
-
249
-
250
-
251
-
252
-
253
-
254
-
255
-
256
-
257
-
258
-
259
-
260
-
261
-
262
-
263
-
264
-
265
-
266
-
267
-
268
-
269
-
270
-
271
-
272
-
273
-
274
-
275
-
276
-
277
-
278
-
279
-
280
-
281
-
282
-
283
-
284
-
285
-
286
-
287
-
288
-
289
-
290
-
291
-
292
-
293
-
294
-
295
-
296
-
297
-
298
-
299
-
300
-
301
-
302
-
303
-
304
-
305
-
306
-
307
-
308
-
309
-
310
-
311
-
312
-
313
-
314
-
315
-
316
-
317
-
318
-
319
-
320
-
321
-
322
-
323
-
324
-
325
-
326
-
327
-
328
-
329
-
330
-
331
-
332
-
333
-
334
-
335
 |
 |
Table of Contents
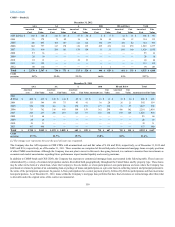
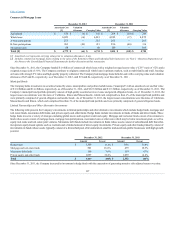
The following table presents the Company’s AFS securities by type, as well as fixed maturities, FVO.
Asset-backed securities (“ABS”)
Consumer loans $2,234 $29 $(116) $ 2,147 2.5%$2,688 $34 $(208) $ 2,514 3.1%
Small business 336 7 (67) 276 0.3%418 1(123)296 0.4%
Other 313 27 — 340 0.4%324 20 (1)343 0.4%
Collateralized debt obligations
("CDOs")
Collateralized loan obligations
(“CLOs”) 2,197 — (68) 2,129 2.5%2,334 —(181)2,153 2.6%
Commercial real estate ("CREs") 420 44 (80)384 0.4%485 16 (167) 334 0.4%
Other [1] 553 16 (11)527 0.6%— — — — —%
Commercial mortgage-backed
securities ("CMBS")
Agency backed [2] 962 79 —1,041 1.2%637 40 —677 0.8%
Bonds 4,535 293 (160)4,668 5.4%5,992 182 (487)5,687 7.0%
Interest only (“IOs”) 586 45 (19) 612 0.7%563 49 (25) 587 0.7%
Corporate
Basic industry [1] 3,741 369 (6) 4,104 4.8%3,690 309 (19) 3,979 4.9%
Capital goods 3,109 389 (2)3,496 4.1%3,327 331 (33)3,625 4.4%
Consumer cyclical 2,423 266 (5) 2,684 3.1%2,277 206 (8)2,475 3.0%
Consumer non-cyclical 5,927 759 (7)6,679 7.8%5,985 644 (13)6,616 8.1%
Energy 3,816 499 (3)4,312 5.0%3,338 381 (15) 3,704 4.5%
Financial services 7,230 604 (211)7,623 8.9%7,763 334 (526)7,571 9.3%
Tech./comm. 3,971 526 (16) 4,481 5.2%4,357 443 (61) 4,739 5.8%
Transportation 1,393 163 (2)1,554 1.8%1,285 123 (6) 1,402 1.7%
Utilities 7,792 1,017 (24)8,785 10.2%8,236 857 (38)9,055 11.2%
Other [1] 292 39 — 331 0.4%903 33 (20) 845 1.0%
Foreign govt./govt. agencies 3,985 191 (40) 4,136 4.8%2,030 141 (10)2,161 2.6%
Municipal Taxable 2,235 246 (15) 2,466 2.9%1,688 120 (51) 1,757 2.1%
Tax-exempt 10,766 1,133 (4)11,895 13.9%10,869 655 (21)11,503 14.1%
Residential mortgage-backed
securities ("RMBS")
Agency 5,906 259 (3)6,162 7.2%4,436 222 — 4,658 5.7%
Non-agency — — — — —%62 —(2) 60 0.1%
Alt-A 38 —(1)37 —%115 5(21)99 0.1%
Sub-prime 1,374 36 (129) 1,281 1.5%1,348 25 (433)940 1.1%
U.S. Treasuries 3,613 175 (16) 3,772 4.4%3,828 203 (2) 4,029 4.9%
Equity securities
Financial services 331 15 (42)304
479 10 (187)302
Other 535 66 (15) 586
577 58 (16) 619
[1] Gross unrealized gains (losses) exclude the fair value of bifurcated embedded derivative features of certain securities. Changes in value are recorded in
net realized capital gains (losses).
[2] Includes securities with pools of loans issued by the Small Business Administration which are backed by the full faith and credit of the U.S.
government.
[3] Includes investments relating to the sales of the Retirement Plans and Individual Life businesses; see Note 2 - Business Dispositions of the Notes to the
Consolidated Financial Statements for further discussion of this transaction.
112