The Hartford 2012 Annual Report Download - page 40
Download and view the complete annual report
Please find page 40 of the 2012 The Hartford annual report below. You can navigate through the pages in the report by either clicking on the pages listed below, or by using the keyword search tool below to find specific information within the annual report.-
 1
1 -
2
-
3
-
4
-
5
-
6
-
7
-
8
-
9
-
10
-
11
-
12
-
13
-
14
-
15
-
16
-
17
-
18
-
19
-
20
-
21
-
22
-
23
-
24
-
25
-
26
-
27
-
28
-
29
-
 30
30 -
 31
31 -
 32
32 -
 33
33 -
 34
34 -
 35
35 -
 36
36 -
 37
37 -
 38
38 -
 39
39 -
 40
40 -
 41
41 -
 42
42 -
 43
43 -
 44
44 -
 45
45 -
 46
46 -
 47
47 -
 48
48 -
 49
49 -
 50
50 -
51
-
52
-
53
-
54
-
55
-
56
-
57
-
58
-
59
-
60
-
61
-
62
-
63
-
64
-
65
-
66
-
67
-
68
-
69
-
70
-
71
-
72
-
73
-
74
-
75
-
76
-
77
-
78
-
79
-
80
-
81
-
82
-
83
-
84
-
85
-
86
-
87
-
88
-
89
-
90
-
91
-
92
-
93
-
94
-
95
-
96
-
97
-
98
-
99
-
100
-
101
-
102
-
103
-
104
-
105
-
106
-
107
-
108
-
109
-
110
-
111
-
112
-
113
-
114
-
115
-
116
-
117
-
118
-
119
-
120
-
121
-
122
-
123
-
124
-
125
-
126
-
127
-
128
-
129
-
130
-
131
-
132
-
133
-
134
-
135
-
136
-
137
-
138
-
139
-
140
-
141
-
142
-
143
-
144
-
145
-
146
-
147
-
148
-
149
-
150
-
151
-
152
-
153
-
154
-
155
-
156
-
157
-
158
-
159
-
160
-
161
-
162
-
163
-
164
-
165
-
166
-
167
-
168
-
169
-
170
-
171
-
172
-
173
-
174
-
175
-
176
-
177
-
178
-
179
-
180
-
181
-
182
-
183
-
184
-
185
-
186
-
187
-
188
-
189
-
190
-
191
-
192
-
193
-
194
-
195
-
196
-
197
-
198
-
199
-
200
-
201
-
202
-
203
-
204
-
205
-
206
-
207
-
208
-
209
-
210
-
211
-
212
-
213
-
214
-
215
-
216
-
217
-
218
-
219
-
220
-
221
-
222
-
223
-
224
-
225
-
226
-
227
-
228
-
229
-
230
-
231
-
232
-
233
-
234
-
235
-
236
-
237
-
238
-
239
-
240
-
241
-
242
-
243
-
244
-
245
-
246
-
247
-
248
-
249
-
250
-
251
-
252
-
253
-
254
-
255
-
256
-
257
-
258
-
259
-
260
-
261
-
262
-
263
-
264
-
265
-
266
-
267
-
268
-
269
-
270
-
271
-
272
-
273
-
274
-
275
-
276
-
277
-
278
-
279
-
280
-
281
-
282
-
283
-
284
-
285
-
286
-
287
-
288
-
289
-
290
-
291
-
292
-
293
-
294
-
295
-
296
-
297
-
298
-
299
-
300
-
301
-
302
-
303
-
304
-
305
-
306
-
307
-
308
-
309
-
310
-
311
-
312
-
313
-
314
-
315
-
316
-
317
-
318
-
319
-
320
-
321
-
322
-
323
-
324
-
325
-
326
-
327
-
328
-
329
-
330
-
331
-
332
-
333
-
334
-
335
 |
 |

Table of Contents
The Hartford provides projections and other forward-looking information in the following discussions, which contain many forward-looking statements,
particularly relating to the Company’s future financial performance. These forward-looking statements are estimates based on information currently available
to the Company, are made pursuant to the safe harbor provisions of the Private Securities Litigation Reform Act of 1995 and are subject to the cautionary
statements set forth on pages 3 and 4 of this Form 10-K and the risk factors set forth under Item 1A and other similar information contained in this Form 10-K
and in other filings made from time to time by the Company with the SEC. Actual results are likely to differ, and in the past have differed, materially from
those forecast by the Company, depending on the outcome of various factors, including, but not limited to, those set forth in each discussion below and in
Item 1A, Risk Factors. The Company undertakes no obligation to publicly update any forward-looking statements, whether as a result of new information,
future developments or otherwise.
Overview
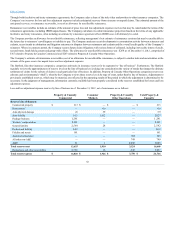
As a result of a strategic business realignment announced in March 2012, the Company is currently focusing on its Property & Casualty, Group Benefits and
Mutual Fund businesses. The objective of this realignment is to position the organization for higher returns on equity, reduced sensitivity to capital markets, a
lower cost of capital and increased financial flexibility.
In 2012, the Company completed the sale of its U.S. individual annuities new business capabilities, the sale of the administration and operating assets of its
private placement life insurance business and the sale of Woodbury Financial Services, Inc. ("WFS"). In January 2013, the Company completed the sale of its
Retirement Plans and Individual Life insurance businesses. For further discussion of these transactions, see Note 2 - Business Dispositions of Notes to
Consolidated Financial Statements.
On January 31, 2013, the Board of Directors authorized a capital management plan which provides for a $500 equity repurchase program to be completed by
December 31, 2014 and the reduction of approximately $1.0 billion of debt including repayment of 2013 and 2014 debt maturities totaling $520 in aggregate
principal amount.
Slow economic and employment expansion may adversely impact the performance of The Hartford’s insurance protection businesses where insureds may
change their level of insurance, and asset accumulation businesses may see customers changing their investment choices and level of savings based on
anticipated economic conditions. In addition, the performance of The Hartford’s divisions is subject to uncertainty due to capital market conditions, which
impact the earnings of its asset management businesses and valuations and earnings in its investment portfolio. The current and future interest rate
environment also affects the performance of the Company’s divisions. A sustained low interest rate environment would result in lower net investment income,
lower estimated gross profits on certain Talcott Resolution products, and lower margins.
Property & Casualty Commercial
Property & Casualty Commercial focuses on growth through market-differentiated products and services while maintaining a disciplined underwriting
approach. Improving market conditions are expected to continue, which should enable the Company to also continue achieving price increases, while a slowly
recovering economy is anticipated to drive a modest increase in insurance exposures. The Company expects low single-digit written premium growth for 2013,
as compared to 2012, driven by small commercial, with programs aimed at growing total policy counts, the rollout of new product enhancements, a leveraging
of the payroll model, and the continued expansion of ease of doing business technology, and middle market, driven by strong pricing and initiatives which
management believes positions the Company to expand its property and general liability footprint. In specialty lines, the Company expects written premiums to
decline as management continues to streamline its programs business and adjust the mix within professional liability. The Property & Casualty Commercial
combined ratio before catastrophes and prior accident year development is expected to improve to between approximately 92.5 and 95.5 for full year 2013 as
compared to the 96.6 achieved in 2012 due to anticipated margin expansion across all businesses as expected earned pricing increases outpace loss costs.
39