The Hartford 2012 Annual Report Download - page 43
Download and view the complete annual report
Please find page 43 of the 2012 The Hartford annual report below. You can navigate through the pages in the report by either clicking on the pages listed below, or by using the keyword search tool below to find specific information within the annual report.-
 1
1 -
2
-
3
-
4
-
5
-
6
-
7
-
8
-
9
-
10
-
11
-
12
-
13
-
14
-
15
-
16
-
17
-
18
-
19
-
20
-
21
-
22
-
23
-
24
-
25
-
26
-
27
-
28
-
29
-
30
-
31
-
32
-
 33
33 -
 34
34 -
 35
35 -
 36
36 -
 37
37 -
 38
38 -
 39
39 -
 40
40 -
 41
41 -
 42
42 -
 43
43 -
 44
44 -
 45
45 -
 46
46 -
 47
47 -
 48
48 -
 49
49 -
 50
50 -
 51
51 -
 52
52 -
 53
53 -
54
-
55
-
56
-
57
-
58
-
59
-
60
-
61
-
62
-
63
-
64
-
65
-
66
-
67
-
68
-
69
-
70
-
71
-
72
-
73
-
74
-
75
-
76
-
77
-
78
-
79
-
80
-
81
-
82
-
83
-
84
-
85
-
86
-
87
-
88
-
89
-
90
-
91
-
92
-
93
-
94
-
95
-
96
-
97
-
98
-
99
-
100
-
101
-
102
-
103
-
104
-
105
-
106
-
107
-
108
-
109
-
110
-
111
-
112
-
113
-
114
-
115
-
116
-
117
-
118
-
119
-
120
-
121
-
122
-
123
-
124
-
125
-
126
-
127
-
128
-
129
-
130
-
131
-
132
-
133
-
134
-
135
-
136
-
137
-
138
-
139
-
140
-
141
-
142
-
143
-
144
-
145
-
146
-
147
-
148
-
149
-
150
-
151
-
152
-
153
-
154
-
155
-
156
-
157
-
158
-
159
-
160
-
161
-
162
-
163
-
164
-
165
-
166
-
167
-
168
-
169
-
170
-
171
-
172
-
173
-
174
-
175
-
176
-
177
-
178
-
179
-
180
-
181
-
182
-
183
-
184
-
185
-
186
-
187
-
188
-
189
-
190
-
191
-
192
-
193
-
194
-
195
-
196
-
197
-
198
-
199
-
200
-
201
-
202
-
203
-
204
-
205
-
206
-
207
-
208
-
209
-
210
-
211
-
212
-
213
-
214
-
215
-
216
-
217
-
218
-
219
-
220
-
221
-
222
-
223
-
224
-
225
-
226
-
227
-
228
-
229
-
230
-
231
-
232
-
233
-
234
-
235
-
236
-
237
-
238
-
239
-
240
-
241
-
242
-
243
-
244
-
245
-
246
-
247
-
248
-
249
-
250
-
251
-
252
-
253
-
254
-
255
-
256
-
257
-
258
-
259
-
260
-
261
-
262
-
263
-
264
-
265
-
266
-
267
-
268
-
269
-
270
-
271
-
272
-
273
-
274
-
275
-
276
-
277
-
278
-
279
-
280
-
281
-
282
-
283
-
284
-
285
-
286
-
287
-
288
-
289
-
290
-
291
-
292
-
293
-
294
-
295
-
296
-
297
-
298
-
299
-
300
-
301
-
302
-
303
-
304
-
305
-
306
-
307
-
308
-
309
-
310
-
311
-
312
-
313
-
314
-
315
-
316
-
317
-
318
-
319
-
320
-
321
-
322
-
323
-
324
-
325
-
326
-
327
-
328
-
329
-
330
-
331
-
332
-
333
-
334
-
335
 |
 |
Table of Contents
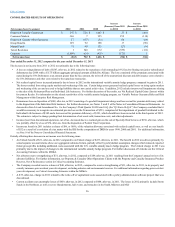
Through both facultative and treaty reinsurance agreements, the Company cedes a share of the risks it has underwritten to other insurance companies. The
Company’s net reserves for loss and loss adjustment expenses include anticipated recovery from reinsurers on unpaid claims. The estimated amount of the
anticipated recovery, or reinsurance recoverable, is net of an allowance for uncollectible reinsurance.
Reinsurance recoverables include an estimate of the amount of gross loss and loss adjustment expense reserves that may be ceded under the terms of the
reinsurance agreements, including IBNR unpaid losses. The Company calculates its ceded reinsurance projection based on the terms of any applicable
facultative and treaty reinsurance, often including an estimate by reinsurance agreement of how IBNR losses will ultimately be ceded.
The Company provides an allowance for uncollectible reinsurance, reflecting management’s best estimate of reinsurance cessions that may be uncollectible in
the future due to reinsurers’ unwillingness or inability to pay. The Company analyzes recent developments in commutation activity between reinsurers and
cedants, recent trends in arbitration and litigation outcomes in disputes between reinsurers and cedants and the overall credit quality of the Company’s
reinsurers. Where its contracts permit, the Company secures future claim obligations with various forms of collateral, including irrevocable letters of credit,
secured trusts, funds held accounts and group-wide offsets. The allowance for uncollectible reinsurance was $268 as of December 31, 2012, comprised of
$65 related to Property & Casualty Commercial and $203 related to Property & Casualty Other Operations.
The Company’s estimate of reinsurance recoverables, net of an allowance for uncollectible reinsurance, is subject to similar risks and uncertainties as the
estimate of the gross reserve for unpaid losses and loss adjustment expenses.
The Hartford, like other insurance companies, categorizes and tracks its insurance reserves for its segments by “line of business”. Furthermore, The Hartford
regularly reviews the appropriateness of reserve levels at the line of business level, taking into consideration the variety of trends that impact the ultimate
settlement of claims for the subsets of claims in each particular line of business. In addition, Property & Casualty Other Operations categorizes reserves as
asbestos and environmental (“A&E”), whereby the Company reviews these reserve levels by type of event, rather than by line of business. Adjustments to
previously established reserves, which may be material, are reflected in the operating results of the period in which the adjustment is determined to be
necessary. In the judgment of management, information currently available has been properly considered in the reserves established for losses and loss
adjustment expenses.
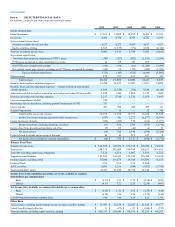
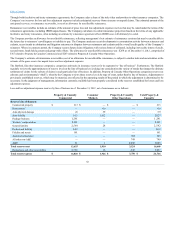
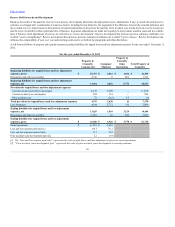
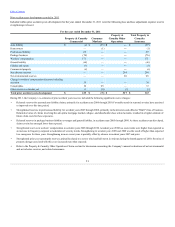
Loss and loss adjustment expense reserves by line of business as of December 31, 2012, net of reinsurance are as follows:
Commercial property $213 $ — $ — $ 213
Homeowners’ —430 —430
Auto physical damage 20 39 — 59
Auto liability 615 1,412 — 2,027
Package business 1,291 — — 1,291
Workers’ compensation 8,101 — — 8,101
General liability 2,564 28 — 2,592
Professional liability 669 — — 669
Fidelity and surety 161 — — 161
Assumed reinsurance — — 309 309
All other non-A&E — — 749 749
A&E 21 1 2,066 2,088
Reinsurance and other recoverables 2,365 16 646 3,027
42