The Hartford 2012 Annual Report Download - page 131
Download and view the complete annual report
Please find page 131 of the 2012 The Hartford annual report below. You can navigate through the pages in the report by either clicking on the pages listed below, or by using the keyword search tool below to find specific information within the annual report.-
 1
1 -
2
-
3
-
4
-
5
-
6
-
7
-
8
-
9
-
10
-
11
-
12
-
13
-
14
-
15
-
16
-
17
-
18
-
19
-
20
-
21
-
22
-
23
-
24
-
25
-
26
-
27
-
28
-
29
-
30
-
31
-
32
-
33
-
34
-
35
-
36
-
37
-
38
-
39
-
40
-
41
-
42
-
43
-
44
-
45
-
46
-
47
-
48
-
49
-
50
-
51
-
52
-
53
-
54
-
55
-
56
-
57
-
58
-
59
-
60
-
61
-
62
-
63
-
64
-
65
-
66
-
67
-
68
-
69
-
70
-
71
-
72
-
73
-
74
-
75
-
76
-
77
-
78
-
79
-
80
-
81
-
82
-
83
-
84
-
85
-
86
-
87
-
88
-
89
-
90
-
91
-
92
-
93
-
94
-
95
-
96
-
97
-
98
-
99
-
100
-
101
-
102
-
103
-
104
-
105
-
106
-
107
-
108
-
109
-
110
-
111
-
112
-
113
-
114
-
115
-
116
-
117
-
118
-
119
-
120
-
 121
121 -
 122
122 -
 123
123 -
 124
124 -
 125
125 -
 126
126 -
 127
127 -
 128
128 -
 129
129 -
 130
130 -
 131
131 -
 132
132 -
 133
133 -
 134
134 -
 135
135 -
 136
136 -
 137
137 -
 138
138 -
 139
139 -
 140
140 -
 141
141 -
142
-
143
-
144
-
145
-
146
-
147
-
148
-
149
-
150
-
151
-
152
-
153
-
154
-
155
-
156
-
157
-
158
-
159
-
160
-
161
-
162
-
163
-
164
-
165
-
166
-
167
-
168
-
169
-
170
-
171
-
172
-
173
-
174
-
175
-
176
-
177
-
178
-
179
-
180
-
181
-
182
-
183
-
184
-
185
-
186
-
187
-
188
-
189
-
190
-
191
-
192
-
193
-
194
-
195
-
196
-
197
-
198
-
199
-
200
-
201
-
202
-
203
-
204
-
205
-
206
-
207
-
208
-
209
-
210
-
211
-
212
-
213
-
214
-
215
-
216
-
217
-
218
-
219
-
220
-
221
-
222
-
223
-
224
-
225
-
226
-
227
-
228
-
229
-
230
-
231
-
232
-
233
-
234
-
235
-
236
-
237
-
238
-
239
-
240
-
241
-
242
-
243
-
244
-
245
-
246
-
247
-
248
-
249
-
250
-
251
-
252
-
253
-
254
-
255
-
256
-
257
-
258
-
259
-
260
-
261
-
262
-
263
-
264
-
265
-
266
-
267
-
268
-
269
-
270
-
271
-
272
-
273
-
274
-
275
-
276
-
277
-
278
-
279
-
280
-
281
-
282
-
283
-
284
-
285
-
286
-
287
-
288
-
289
-
290
-
291
-
292
-
293
-
294
-
295
-
296
-
297
-
298
-
299
-
300
-
301
-
302
-
303
-
304
-
305
-
306
-
307
-
308
-
309
-
310
-
311
-
312
-
313
-
314
-
315
-
316
-
317
-
318
-
319
-
320
-
321
-
322
-
323
-
324
-
325
-
326
-
327
-
328
-
329
-
330
-
331
-
332
-
333
-
334
-
335
 |
 |

Table of Contents
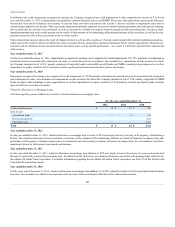
Year ended December 31, 2011 compared to the year ended December 31, 2010
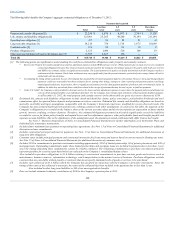
The decrease in cash provided by operating activities compared to the prior year period reflected an increase in losses paid on property and casualty insurance
products, and to a lesser extent, lower net investment income on available-for-sale securities, excluding limited partnerships and other alternative investments.
Cash used for investing activities in 2011 primarily relates to net purchases of mortgage loans of $1.3 billion and net purchases of fixed maturities, fair value
option of $627, partially offset by net receipts on derivatives of $720 and net proceeds of available-for-sale securities of $256. Cash used for investing
activities in 2010 primarily relates to net purchases of available-for-sale securities of $1.5 billion and net payments on derivatives of $338, partially offset by
net proceeds from sales of mortgage loans of $1.4 billion.
Cash used for financing activities in 2011 primarily consists of repayment of long-term debt and dividends paid on common and preferred stock, partially
offset by net inflows on investment and universal life-type contracts. In the comparable prior period of 2010, cash used for financing activities increased
primarily due to repayments of consumer notes of $754, repayment of $275 in senior notes and net outflows on investment and universal life-type contracts.
Operating cash flows in each of the last three years have been adequate to meet liquidity requirements.
Equity Markets
For a discussion of the potential impact of the equity markets on capital and liquidity, see the Financial Risk on Statutory Capital and Liquidity Risk section
in this MD&A.
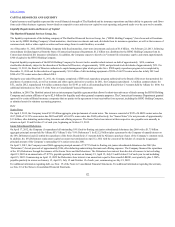
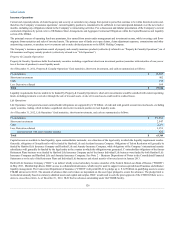
Ratings
Ratings impact the Company’s cost of borrowing and its ability to access financing and are an important factor in establishing competitive position in the
insurance and financial services marketplace. There can be no assurance that the Company’s ratings will continue for any given period of time or that they
will not be changed. In the event the Company’s ratings are downgraded, the Company’s cost of borrowing and ability to access financing, as well as the level
of revenues or the persistency of its business may be adversely impacted.
On February 5, 2013, Moody's Investors Service affirmed the insurance financial strength ratings of Hartford Fire Insurance Company, Hartford Life
Insurance Company and Hartford Life & Accident Insurance Company. Moody's downgraded the insurance financial strength ratings of Hartford Life and
Annuity Insurance Company to Baa2 from A3. The outlook for all of the ratings is stable.
On March 1, 2013 A.M. Best affirmed the issuer credit ratings of the HFSG Holding Company and the financial strength ratings of Hartford Fire Insurance
Company and changed the outlook to stable. A.M. Best downgraded the financial strength ratings of Hartford Life Insurance Company, Hartford Life and
Accident Insurance Company and Hartford Life and Annuity Insurance Company to A- from A and changed outlook to stable.
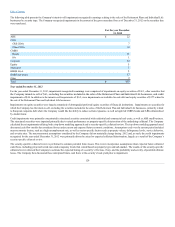
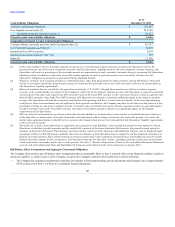
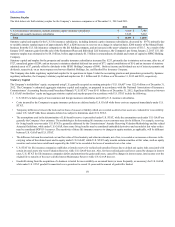
The following table summarizes The Hartford’s significant member companies’ financial ratings from the major independent rating organizations as of March
1, 2013:
Insurance Financial Strength Ratings:
Hartford Fire Insurance Company AA+ AA2
Hartford Life Insurance Company A- A- A- A3
Hartford Life and Accident Insurance Company A- A- A- A3
Hartford Life and Annuity Insurance Company A- A- BBB+ Baa2
Other Ratings:
The Hartford Financial Services Group, Inc.:
Senior debt bbb+ BBB BBB Baa3
Commercial paper AMB-2 F2 A-2 P-3
These ratings are not a recommendation to buy or hold any of The Hartford’s securities and they may be revised or revoked at any time at the sole discretion of
the rating organization.
The agencies consider many factors in determining the final rating of an insurance company. One consideration is the relative level of statutory surplus
necessary to support the business written. Statutory surplus represents the capital of the insurance company reported in accordance with accounting practices
prescribed by the applicable state insurance department. See Part I, Item 1A. Risk Factors — “Downgrades in our financial strength or credit ratings, which
may make our products less attractive, could increase our cost of capital and inhibit our ability to refinance our debt, which would have a material adverse
effect on our business, financial condition, results of operations and liquidity.”
130