The Hartford 2012 Annual Report Download - page 239
Download and view the complete annual report
Please find page 239 of the 2012 The Hartford annual report below. You can navigate through the pages in the report by either clicking on the pages listed below, or by using the keyword search tool below to find specific information within the annual report.-
 1
1 -
2
-
3
-
4
-
5
-
6
-
7
-
8
-
9
-
10
-
11
-
12
-
13
-
14
-
15
-
16
-
17
-
18
-
19
-
20
-
21
-
22
-
23
-
24
-
25
-
26
-
27
-
28
-
29
-
30
-
31
-
32
-
33
-
34
-
35
-
36
-
37
-
38
-
39
-
40
-
41
-
42
-
43
-
44
-
45
-
46
-
47
-
48
-
49
-
50
-
51
-
52
-
53
-
54
-
55
-
56
-
57
-
58
-
59
-
60
-
61
-
62
-
63
-
64
-
65
-
66
-
67
-
68
-
69
-
70
-
71
-
72
-
73
-
74
-
75
-
76
-
77
-
78
-
79
-
80
-
81
-
82
-
83
-
84
-
85
-
86
-
87
-
88
-
89
-
90
-
91
-
92
-
93
-
94
-
95
-
96
-
97
-
98
-
99
-
100
-
101
-
102
-
103
-
104
-
105
-
106
-
107
-
108
-
109
-
110
-
111
-
112
-
113
-
114
-
115
-
116
-
117
-
118
-
119
-
120
-
121
-
122
-
123
-
124
-
125
-
126
-
127
-
128
-
129
-
130
-
131
-
132
-
133
-
134
-
135
-
136
-
137
-
138
-
139
-
140
-
141
-
142
-
143
-
144
-
145
-
146
-
147
-
148
-
149
-
150
-
151
-
152
-
153
-
154
-
155
-
156
-
157
-
158
-
159
-
160
-
161
-
162
-
163
-
164
-
165
-
166
-
167
-
168
-
169
-
170
-
171
-
172
-
173
-
174
-
175
-
176
-
177
-
178
-
179
-
180
-
181
-
182
-
183
-
184
-
185
-
186
-
187
-
188
-
189
-
190
-
191
-
192
-
193
-
194
-
195
-
196
-
197
-
198
-
199
-
200
-
201
-
202
-
203
-
204
-
205
-
206
-
207
-
208
-
209
-
210
-
211
-
212
-
213
-
214
-
215
-
216
-
217
-
218
-
219
-
220
-
221
-
222
-
223
-
224
-
225
-
226
-
227
-
228
-
 229
229 -
 230
230 -
 231
231 -
 232
232 -
 233
233 -
 234
234 -
 235
235 -
 236
236 -
 237
237 -
 238
238 -
 239
239 -
 240
240 -
 241
241 -
 242
242 -
 243
243 -
 244
244 -
 245
245 -
 246
246 -
 247
247 -
 248
248 -
 249
249 -
250
-
251
-
252
-
253
-
254
-
255
-
256
-
257
-
258
-
259
-
260
-
261
-
262
-
263
-
264
-
265
-
266
-
267
-
268
-
269
-
270
-
271
-
272
-
273
-
274
-
275
-
276
-
277
-
278
-
279
-
280
-
281
-
282
-
283
-
284
-
285
-
286
-
287
-
288
-
289
-
290
-
291
-
292
-
293
-
294
-
295
-
296
-
297
-
298
-
299
-
300
-
301
-
302
-
303
-
304
-
305
-
306
-
307
-
308
-
309
-
310
-
311
-
312
-
313
-
314
-
315
-
316
-
317
-
318
-
319
-
320
-
321
-
322
-
323
-
324
-
325
-
326
-
327
-
328
-
329
-
330
-
331
-
332
-
333
-
334
-
335
 |
 |

Table of Contents
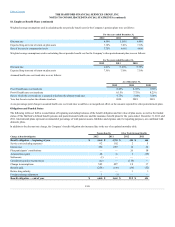
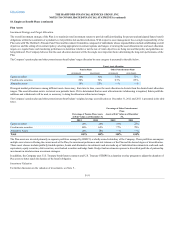
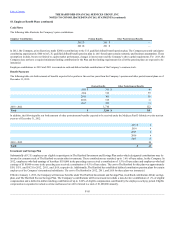
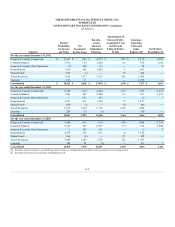
Expected dividend yield 1.3% 1.3%
Expected annualized spot volatility 38.6%-51.5% 35.8%-47.1%
Weighted average annualized volatility 51.4% 41.7%
Risk-free spot rate 0.1%-2.0% 0.1%-3.5%
Expected term 5.2 years 5.7 years
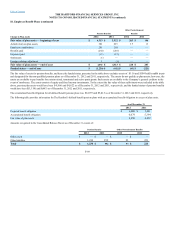
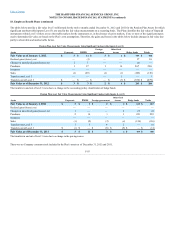
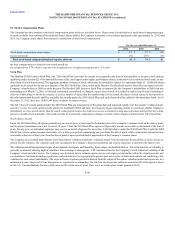
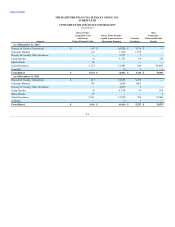
A summary of the status of non-qualified stock options included in the Company’s Stock Plans as of December 31, 2012 and changes during the year ended
December 31, 2012 is presented below:
Outstanding at beginning of year $ 47.89 3.7 $ —
Granted 1,582 20.63
Exercised (363)7.37
Forfeited (600) 45.12
Expired (921) 65.27
Outstanding at end of year 4,537 38.42 5.2 —
Exercisable at end of year 2,537 $50.51 2.5 —
The weighted average grant-date fair value of options granted during the years ended December 31, 2012 and 2011 was $7.41 and $10.76 respectively. The
total intrinsic value of options exercised during the years ended December 31, 2012, 2011 and 2010 was $4, $2, and $1, respectively.
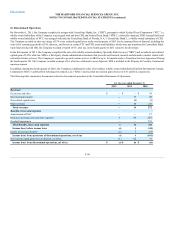
Share Awards
Share awards are valued equal to the market price of the Company’s common stock on the date of grant. Share awards granted under the Stock Plans and
outstanding include restricted stock units, restricted stock and performance shares. Generally, restricted stock units vest at or over three years and restricted
stock vests in three to five years. Performance shares become payable within a range of 0% to 200% of the number of shares initially granted based upon the
attainment of specific performance goals achieved over a specified period, generally three years. The maximum award of restricted stock units, restricted stock
or performance shares for any individual employee in any year under the 2010 Stock Plan is 500,000 shares or units.
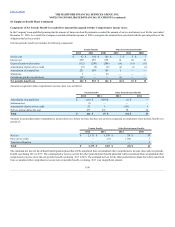
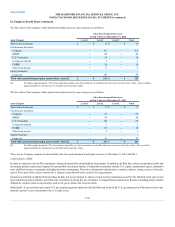
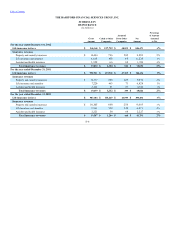
A summary of the status of the Company’s non-vested share awards as of December 31, 2012, and changes during the year ended December 31, 2012, is
presented below:
Non-vested at beginning of year 4,164 $ 27.60
Granted 4,667 20.56
Vested (956)30.13
Forfeited (884) 24.25
The total fair value of shares vested during the years ended December 31, 2012, 2011 and 2010 was $20, $20 and $13, respectively, based on estimated
performance factors. The Company did not make cash payments in settlement of stock compensation during the years ended December 31, 2012 and 2011
and 2010.
F-97