The Hartford 2012 Annual Report Download - page 109
Download and view the complete annual report
Please find page 109 of the 2012 The Hartford annual report below. You can navigate through the pages in the report by either clicking on the pages listed below, or by using the keyword search tool below to find specific information within the annual report.-
 1
1 -
2
-
3
-
4
-
5
-
6
-
7
-
8
-
9
-
10
-
11
-
12
-
13
-
14
-
15
-
16
-
17
-
18
-
19
-
20
-
21
-
22
-
23
-
24
-
25
-
26
-
27
-
28
-
29
-
30
-
31
-
32
-
33
-
34
-
35
-
36
-
37
-
38
-
39
-
40
-
41
-
42
-
43
-
44
-
45
-
46
-
47
-
48
-
49
-
50
-
51
-
52
-
53
-
54
-
55
-
56
-
57
-
58
-
59
-
60
-
61
-
62
-
63
-
64
-
65
-
66
-
67
-
68
-
69
-
70
-
71
-
72
-
73
-
74
-
75
-
76
-
77
-
78
-
79
-
80
-
81
-
82
-
83
-
84
-
85
-
86
-
87
-
88
-
89
-
90
-
91
-
92
-
93
-
94
-
95
-
96
-
97
-
98
-
 99
99 -
 100
100 -
 101
101 -
 102
102 -
 103
103 -
 104
104 -
 105
105 -
 106
106 -
 107
107 -
 108
108 -
 109
109 -
 110
110 -
 111
111 -
 112
112 -
 113
113 -
 114
114 -
 115
115 -
 116
116 -
 117
117 -
 118
118 -
 119
119 -
120
-
121
-
122
-
123
-
124
-
125
-
126
-
127
-
128
-
129
-
130
-
131
-
132
-
133
-
134
-
135
-
136
-
137
-
138
-
139
-
140
-
141
-
142
-
143
-
144
-
145
-
146
-
147
-
148
-
149
-
150
-
151
-
152
-
153
-
154
-
155
-
156
-
157
-
158
-
159
-
160
-
161
-
162
-
163
-
164
-
165
-
166
-
167
-
168
-
169
-
170
-
171
-
172
-
173
-
174
-
175
-
176
-
177
-
178
-
179
-
180
-
181
-
182
-
183
-
184
-
185
-
186
-
187
-
188
-
189
-
190
-
191
-
192
-
193
-
194
-
195
-
196
-
197
-
198
-
199
-
200
-
201
-
202
-
203
-
204
-
205
-
206
-
207
-
208
-
209
-
210
-
211
-
212
-
213
-
214
-
215
-
216
-
217
-
218
-
219
-
220
-
221
-
222
-
223
-
224
-
225
-
226
-
227
-
228
-
229
-
230
-
231
-
232
-
233
-
234
-
235
-
236
-
237
-
238
-
239
-
240
-
241
-
242
-
243
-
244
-
245
-
246
-
247
-
248
-
249
-
250
-
251
-
252
-
253
-
254
-
255
-
256
-
257
-
258
-
259
-
260
-
261
-
262
-
263
-
264
-
265
-
266
-
267
-
268
-
269
-
270
-
271
-
272
-
273
-
274
-
275
-
276
-
277
-
278
-
279
-
280
-
281
-
282
-
283
-
284
-
285
-
286
-
287
-
288
-
289
-
290
-
291
-
292
-
293
-
294
-
295
-
296
-
297
-
298
-
299
-
300
-
301
-
302
-
303
-
304
-
305
-
306
-
307
-
308
-
309
-
310
-
311
-
312
-
313
-
314
-
315
-
316
-
317
-
318
-
319
-
320
-
321
-
322
-
323
-
324
-
325
-
326
-
327
-
328
-
329
-
330
-
331
-
332
-
333
-
334
-
335
 |
 |

Table of Contents
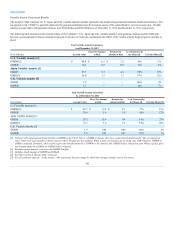
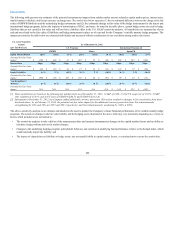
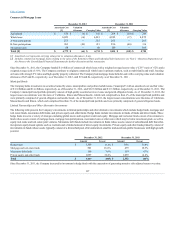
The Company uses currency swaps to manage the foreign currency risk associated with the yen denominated individual fixed annuity product. As of
December 31, 2012 and 2011, the notional value of the currency swaps was $1.7 billion and $1.9 billion and the fair value was $224 and $514,
respectively. The currency swaps are recorded at fair value, incorporating changes in value due to changes in forward foreign exchange rates, interest rates and
accrued income. A before-tax net loss of $(36) and net gains of $3 and $27 for the years ended December 31, 2012, 2011 and 2010, respectively, which
includes the changes in value of the currency swaps, excluding net periodic coupon settlements, and the yen fixed annuity contract remeasurement, was
recorded in net realized capital gains and losses.
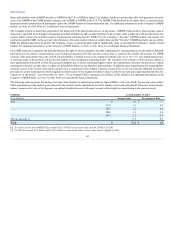
Statutory surplus amounts and risk-based capital (“RBC”) ratios may increase or decrease in any period depending upon a variety of factors and may be
compounded in extreme scenarios or if multiple factors occur at the same time. At times the impact of changes in certain market factors or a combination of
multiple factors on RBC ratios can be counterintuitive. Factors include:
•In general, as equity market levels and interest rates decline, the amount and volatility of both our actual potential obligation, as well as the related
statutory surplus and capital margin for death and living benefit guarantees associated with U.S. variable annuity contracts can be materially negatively
affected, sometimes at a greater than linear rate. Other market factors that can impact statutory surplus, reserve levels and capital margin include
differences in performance of variable subaccounts relative to indices and/or realized equity and interest rate volatilities. In addition, as equity market
levels increase, generally surplus levels will increase. RBC ratios will also tend to increase when equity markets increase. However, as a result of a
number of factors and market conditions, including the level of hedging costs and other risk transfer activities, reserve requirements for death and
living benefit guarantees and RBC requirements could increase with rising equity markets, resulting in lower RBC ratios. Non-market factors, which
can also impact the amount and volatility of both our actual potential obligation, as well as the related statutory surplus and capital margin, include
actual and estimated policyholder behavior experience as it pertains to lapsation, partial withdrawals, and mortality.
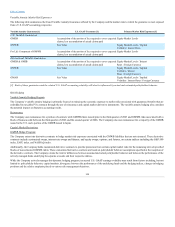
•Similarly, for guaranteed benefits (GMDB, GMIB, and GMWB) reinsured from our international operations to our U.S. insurance subsidiaries, the
amount and volatility of both our actual potential obligation, as well as the related statutory surplus and capital margin can be materially affected by a
variety of factors, both market and non-market. Market factors include declines in various equity market indices and interest rates, changes in value of
the yen versus other global currencies, difference in the performance of variable subaccounts relative to indices, and increases in realized equity, interest
rate, and currency volatilities. Non-market factors include actual and estimated policyholder behavior experience as it pertains to lapsation,
withdrawals, mortality, and annuitization. Risk mitigation activities, such as hedging, may also result in material and sometimes counterintuitive
impacts on statutory surplus and capital margin. Notably, as changes in these market and non-market factors occur, both our potential obligation and
the related statutory reserves and/or required capital can increase or decrease at a greater than linear rate.
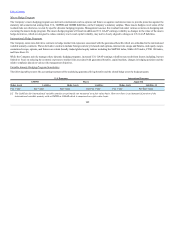
•As the value of certain fixed-income and equity securities in our investment portfolio decreases, due in part to credit spread widening, statutory surplus
and RBC ratios may decrease.
•As the value of certain derivative instruments that do not qualify for hedge accounting decreases, statutory surplus and RBC ratios may decrease.
•The life insurance subsidiaries’ exposure to foreign currency exchange risk exists with respect to non-U.S. dollar denominated assets and liabilities.
Assets and liabilities denominated in foreign currencies are accounted for at their U.S. dollar equivalent values using exchange rates at the balance sheet
date. As foreign currency exchange rates vary in comparison to the U.S. dollar, the remeasured value of those non-dollar denominated assets or liabilities
will also vary, causing an increase or decrease to statutory surplus.
•Our statutory surplus is also impacted by widening credit spreads as a result of the accounting for the assets and liabilities in our fixed market value
adjusted (“MVA”) annuities. Statutory separate account assets supporting the fixed MVA annuities are recorded at fair value. In determining the
statutory reserve for the fixed MVA annuities, we are required to use current crediting rates in the U.S. and Japanese LIBOR in Japan. In many capital
market scenarios, current crediting rates in the U.S. are highly correlated with market rates implicit in the fair value of statutory separate account assets.
As a result, the change in statutory reserve from period to period will likely substantially offset the change in the fair value of the statutory separate
account assets. However, in periods of volatile credit markets, actual credit spreads on investment assets may increase sharply for certain sub-sectors of
the overall credit market, resulting in statutory separate account asset market value losses. As actual credit spreads are not fully reflected in the current
crediting rates in the U.S. or Japanese LIBOR in Japan, the calculation of statutory reserves will not substantially offset the change in fair value of the
statutory separate account assets resulting in reductions in statutory surplus. This has resulted and may continue to result in the need to devote
significant additional capital to support the product.
Most of these factors are outside of the Company’s control. The Company’s financial strength and credit ratings are significantly influenced by the statutory
surplus amounts and RBC ratios of our insurance company subsidiaries. In addition, rating agencies may implement changes to their internal models that
have the effect of increasing or decreasing the amount of statutory capital we must hold in order to maintain our current ratings.
108