Shaw 2010 Annual Report Download - page 88
Download and view the complete annual report
Please find page 88 of the 2010 Shaw annual report below. You can navigate through the pages in the report by either clicking on the pages listed below, or by using the keyword search tool below to find specific information within the annual report.-
 1
1 -
2
-
3
-
4
-
5
-
6
-
7
-
8
-
9
-
10
-
11
-
12
-
13
-
14
-
15
-
16
-
17
-
18
-
19
-
20
-
21
-
22
-
23
-
24
-
25
-
26
-
27
-
28
-
29
-
30
-
31
-
32
-
33
-
34
-
35
-
36
-
37
-
38
-
39
-
40
-
41
-
42
-
43
-
44
-
45
-
46
-
47
-
48
-
49
-
50
-
51
-
52
-
53
-
54
-
55
-
56
-
57
-
58
-
59
-
60
-
61
-
62
-
63
-
64
-
65
-
66
-
67
-
68
-
69
-
70
-
71
-
72
-
73
-
74
-
75
-
76
-
77
-
 78
78 -
 79
79 -
 80
80 -
 81
81 -
 82
82 -
 83
83 -
 84
84 -
 85
85 -
 86
86 -
 87
87 -
 88
88 -
 89
89 -
 90
90 -
 91
91 -
 92
92 -
 93
93 -
 94
94 -
 95
95 -
 96
96 -
 97
97 -
 98
98 -
99
-
100
-
101
-
102
-
103
-
104
-
105
-
106
-
107
-
108
-
109
-
110
-
111
-
112
-
113
-
114
-
115
-
116
-
117
-
118
-
119
-
120
-
121
-
122
-
123
-
124
-
125
-
126
 |
 |

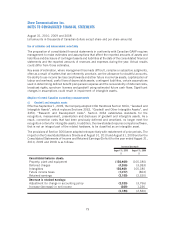
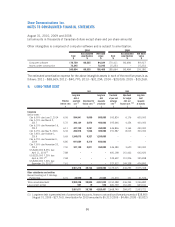
6. PROPERTY, PLANT AND EQUIPMENT
Cost
$
Accumulated
amortization
$
Net book
value
$
Cost
$
Accumulated
amortization
$
Net book
value
$
2010 2009
Cable and
telecommunications
distribution system 4,197,319 2,129,039 2,068,280 3,831,193 1,868,705 1,962,488
Digital cable terminals and
modems 552,224 223,910 328,314 377,698 150,749 226,949
Satellite audio, video and
data network equipment
and DTH receiving
equipment 154,156 115,139 39,017 154,916 104,600 50,316
Buildings 360,841 121,312 239,529 343,605 106,986 236,619
Data processing 53,811 30,679 23,132 57,032 31,651 25,381
Other assets 256,910 120,020 136,890 251,925 119,895 132,030
5,575,261 2,740,099 2,835,162 5,016,369 2,382,586 2,633,783
Land 45,368 – 45,368 44,860 – 44,860
Assets under construction 124,119 – 124,119 37,721 – 37,721
5,744,748 2,740,099 3,004,649 5,098,950 2,382,586 2,716,364
Included in the cable and telecommunications distribution system assets is the cost of the Company’s
purchase of fibres under IRU agreements with terms extending to 60 years totalling $61,811
(2009 – $61,811). In 2010, the Company recognized a gain (loss) of ($2,665) (2009 – $8,360;
2008 – $270) on the disposal of property, plant and equipment.
7. DEFERRED CHARGES
Cost
$
Accumulated
amortization
$
Net book
value
$
Cost
$
Accumulated
amortization
$
Net book
value
$
2010 2009
Equipment costs subject to a
deferred revenue arrangement 687,879 485,449 202,430 710,810 481,591 229,219
Financing costs and credit facility
arrangement fees 5,039 3,276 1,763 5,039 2,268 2,771
Connection and installation costs 88 88 – 684 641 43
Other 28,803 153 28,650 24,458 136 24,322
721,809 488,966 232,843 740,991 484,636 256,355
Amortization provided in the accounts on deferred charges for 2010 amounted to $229,782
(2009 – $248,308; 2008 – $229,917) of which $229,739 was recorded as amortization of
deferred charges and equipment costs (2009 – $248,135; 2008 – $229,549) and $43 was
recorded as operating, general and administrative expenses (2009 – $173; 2008 – $368).
84
Shaw Communications Inc.
NOTES TO CONSOLIDATED FINANCIAL STATEMENTS
August 31, 2010, 2009 and 2008
[all amounts in thousands of Canadian dollars except share and per share amounts]