Shaw 2010 Annual Report Download - page 101
Download and view the complete annual report
Please find page 101 of the 2010 Shaw annual report below. You can navigate through the pages in the report by either clicking on the pages listed below, or by using the keyword search tool below to find specific information within the annual report.-
 1
1 -
2
-
3
-
4
-
5
-
6
-
7
-
8
-
9
-
10
-
11
-
12
-
13
-
14
-
15
-
16
-
17
-
18
-
19
-
20
-
21
-
22
-
23
-
24
-
25
-
26
-
27
-
28
-
29
-
30
-
31
-
32
-
33
-
34
-
35
-
36
-
37
-
38
-
39
-
40
-
41
-
42
-
43
-
44
-
45
-
46
-
47
-
48
-
49
-
50
-
51
-
52
-
53
-
54
-
55
-
56
-
57
-
58
-
59
-
60
-
61
-
62
-
63
-
64
-
65
-
66
-
67
-
68
-
69
-
70
-
71
-
72
-
73
-
74
-
75
-
76
-
77
-
78
-
79
-
80
-
81
-
82
-
83
-
84
-
85
-
86
-
87
-
88
-
89
-
90
-
 91
91 -
 92
92 -
 93
93 -
 94
94 -
 95
95 -
 96
96 -
 97
97 -
 98
98 -
 99
99 -
 100
100 -
 101
101 -
 102
102 -
 103
103 -
 104
104 -
 105
105 -
 106
106 -
 107
107 -
 108
108 -
 109
109 -
 110
110 -
 111
111 -
112
-
113
-
114
-
115
-
116
-
117
-
118
-
119
-
120
-
121
-
122
-
123
-
124
-
125
-
126
 |
 |

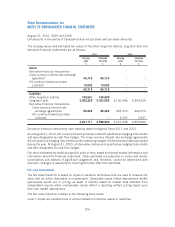
15. BUSINESS SEGMENT INFORMATION
The Company’s operating segments are Cable, Wireless, DTH and Satellite Services, all of which are
substantially located in Canada. During the current year, the Company commenced its initial
wireless activities and began reporting this new business as a separate operating unit. Accordingly,
deposits on AWS spectrum licenses as at August 31, 2009 and 2008 have been reclassified from
corporate assets to the Wireless segment. All of these operations are substantially located in
Canada. The accounting policies of the segments are the same as those described in the summary of
significant accounting policies. Management evaluates divisional performance based on service
revenue and service operating income before charges such as amortization.
Cable
$
Wireless
$
DTH
$
Satellite Services
$
Total
$
Total
$
Satellite
2010
Service revenue – total 2,931,976 – 721,952 82,600 804,552 3,736,528
Intersegment (4,565) – (10,883) (3,500) (14,383) (18,948)
2,927,411 – 711,069 79,100 790,169 3,717,580
Service operating income (expenditures) before
amortization
(6)
1,456,827 (1,396) 265,016 38,304 303,320 1,758,751
Service operating income as % of external revenue 49.8% – 37.3% 48.4% 38.4% 47.3%
Interest
(1)
213,898 6,536 n/a n/a 26,251 246,685
Burrard Landing Lot 2 Holdings Partnership 1,326
248,011
Cash taxes
(2)
136,000 – n/a n/a 44,000 180,000
Corporate/other (12,233)
167,767
Segment assets 7,111,526 287,626 844,502 483,404 1,327,906 8,727,058
Corporate assets 1,426,907
Total assets 10,153,965
Capital expenditures and equipment costs (net)
by segment
Capital expenditures 739,136 96,714 3,139 2,113 5,252 841,102
Equipment costs (net) 17,949 – 80,359 – 80,359 98,308
757,085 96,714 83,498 2,113 85,611 939,410
Reconciliation to Consolidated Statements of Cash Flows
Additions to property, plant and equipment 681,589
Additions to equipment costs (net) 98,308
Additions to other intangibles 60,785
Total of capital expenditures and equipment costs
(net) per Consolidated Statements of Cash Flows 840,682
Increase in working capital related to capital
expenditures 102,232
Less: Proceeds on disposal of property, plant and
equipment (430)
Less: Satellite services equipment profit
(4)
(3,040)
Less: Partnership capital expenditures
(5)
(34)
Total capital expenditures and equipment costs (net)
reported by segments 939,410
See notes following 2008 business segment table.
97
Shaw Communications Inc.
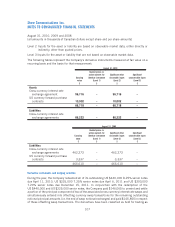
NOTES TO CONSOLIDATED FINANCIAL STATEMENTS
August 31, 2010, 2009 and 2008
[all amounts in thousands of Canadian dollars except share and per share amounts]