Shaw 2010 Annual Report Download - page 48
Download and view the complete annual report
Please find page 48 of the 2010 Shaw annual report below. You can navigate through the pages in the report by either clicking on the pages listed below, or by using the keyword search tool below to find specific information within the annual report.-
 1
1 -
2
-
3
-
4
-
5
-
6
-
7
-
8
-
9
-
10
-
11
-
12
-
13
-
14
-
15
-
16
-
17
-
18
-
19
-
20
-
21
-
22
-
23
-
24
-
25
-
26
-
27
-
28
-
29
-
30
-
31
-
32
-
33
-
34
-
35
-
36
-
37
-
 38
38 -
 39
39 -
 40
40 -
 41
41 -
 42
42 -
 43
43 -
 44
44 -
 45
45 -
 46
46 -
 47
47 -
 48
48 -
 49
49 -
 50
50 -
 51
51 -
 52
52 -
 53
53 -
 54
54 -
 55
55 -
 56
56 -
 57
57 -
 58
58 -
59
-
60
-
61
-
62
-
63
-
64
-
65
-
66
-
67
-
68
-
69
-
70
-
71
-
72
-
73
-
74
-
75
-
76
-
77
-
78
-
79
-
80
-
81
-
82
-
83
-
84
-
85
-
86
-
87
-
88
-
89
-
90
-
91
-
92
-
93
-
94
-
95
-
96
-
97
-
98
-
99
-
100
-
101
-
102
-
103
-
104
-
105
-
106
-
107
-
108
-
109
-
110
-
111
-
112
-
113
-
114
-
115
-
116
-
117
-
118
-
119
-
120
-
121
-
122
-
123
-
124
-
125
-
126
 |
 |

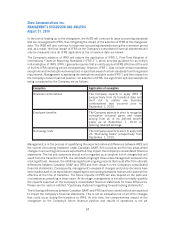
xi) Dividend payments
The Company currently pays monthly dividends in amounts approved on a quarterly basis by the
Board of Directors. At the current approved dividend amount, the Company would pay
approximately $380.0 million in dividends during 2011. While the Company expects to generate
sufficient free cash flow in 2011 to fund these dividend payments, if actual results are different
from expectations there can be no assurance that the Company will continue dividend payments at
the current level.
xii) Acquisitions and other strategic transactions
The Company may from time to time make acquisitions and enter into other strategic transactions.
In connection with these acquisitions and strategic transactions, Shaw may fail to realize the
anticipated benefits, incur unanticipated expenses and/or have difficulty incorporating or
integrating the acquired business, the occurrence of which could have a material adverse effect
on the Company.
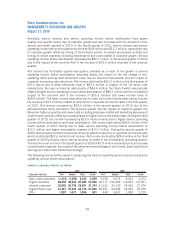
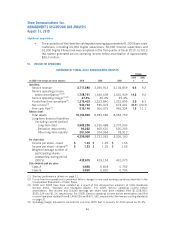
II. SUMMARY OF QUARTERLY RESULTS
(In $000’s Cdn except per share amounts)
Quarter
Service
revenue
Service
operating income
before
amortization
(1)(4)
Net income
(4)
Basic
earnings
per share
(2)(4)
Funds flow
from
operations
(3)
2010
Fourth 938,872 423,152 121,575 0.28 327,435
Third 943,632 435,822 158,216 0.37 350,810
Second 929,142 424,825 138,712 0.32 358,206
First 905,934 474,952 114,229 0.26 338,952
Total 3,717,580 1,758,751 532,732 1.23 1,375,403
2009
Fourth 872,919 394,900 124,265 0.29 321,319
Third 861,382 395,547 132,151 0.31 356,046
Second 839,144 381,832 156,585 0.37 334,508
First 817,468 368,330 123,474 0.29 311,967
Total 3,390,913 1,540,609 536,475 1.25 1,323,840
(1) See key performance drivers on page 21.
(2) Diluted earnings per share equals basic earnings per share except for the second quarter of 2009 where
diluted earnings per share is $0.36.
(3) Funds flow from operations is presented before changes in net non-cash working capital as presented in
the Consolidated Statement of Cash Flows.
(4) 2009 is restated for the retrospective adoption of CICA Handbook Section 3064, “Goodwill and
Intangible Assets”. See new accounting standards on page 31.
44
Shaw Communications Inc.
MANAGEMENT’S DISCUSSION AND ANALYSIS
August 31, 2010