Shaw 2010 Annual Report Download - page 49
Download and view the complete annual report
Please find page 49 of the 2010 Shaw annual report below. You can navigate through the pages in the report by either clicking on the pages listed below, or by using the keyword search tool below to find specific information within the annual report.-
 1
1 -
2
-
3
-
4
-
5
-
6
-
7
-
8
-
9
-
10
-
11
-
12
-
13
-
14
-
15
-
16
-
17
-
18
-
19
-
20
-
21
-
22
-
23
-
24
-
25
-
26
-
27
-
28
-
29
-
30
-
31
-
32
-
33
-
34
-
35
-
36
-
37
-
38
-
 39
39 -
 40
40 -
 41
41 -
 42
42 -
 43
43 -
 44
44 -
 45
45 -
 46
46 -
 47
47 -
 48
48 -
 49
49 -
 50
50 -
 51
51 -
 52
52 -
 53
53 -
 54
54 -
 55
55 -
 56
56 -
 57
57 -
 58
58 -
 59
59 -
60
-
61
-
62
-
63
-
64
-
65
-
66
-
67
-
68
-
69
-
70
-
71
-
72
-
73
-
74
-
75
-
76
-
77
-
78
-
79
-
80
-
81
-
82
-
83
-
84
-
85
-
86
-
87
-
88
-
89
-
90
-
91
-
92
-
93
-
94
-
95
-
96
-
97
-
98
-
99
-
100
-
101
-
102
-
103
-
104
-
105
-
106
-
107
-
108
-
109
-
110
-
111
-
112
-
113
-
114
-
115
-
116
-
117
-
118
-
119
-
120
-
121
-
122
-
123
-
124
-
125
-
126
 |
 |

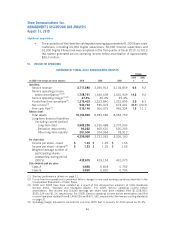
Generally, service revenue and service operating income before amortization have grown
quarter-over-quarter mainly due to customer growth and rate increases with the exception of the
second and fourth quarters of 2010. In the fourth quarter of 2010, service revenue and service
operating income before amortization declined by $4.8 million and $12.7 million, respectively due
to customer growth offset by timing of On-Demand events, increased promotional activity and
timing of certain expenses including maintenance and costs related to customer growth. Service
operating income before amortization decreased by $50.1 million in the second quarter of 2010
due to the impact of the one-time Part II fee recovery of $75.3 million recorded in the previous
quarter.
Net income has fluctuated quarter-over-quarter primarily as a result of the growth in service
operating income before amortization described above, the impact of the net change in non-
operating items such as debt retirement costs, loss on financial instruments, and the impact of
corporate income tax rate reductions. Net income declined by $10.0 million in the first quarter of
2010 mainly due to debt retirement costs of $81.6 million in respect of the US senior note
redemptions, the loss on financial instruments of $44.6 million, the total of which was partially
offset by higher service operating income before amortization of $80.1 million (which includes the
impact of the one-time Part II fee recovery of $75.3 million) and lower income taxes of
$28.9 million. The lower income taxes were due to lower net income before taxes and an income
tax recovery of $17.6 million related to reductions in corporate income tax rates in the first quarter
of 2010. Net income increased by $24.5 million in the second quarter of 2010 due to the
aforementioned items recorded in the previous quarter and the impact of customer growth, the
Mountain Cable acquisition and lower costs including employee related and marketing expenses all
of which were partially offset by increased taxes on higher net income before taxes. During the third
quarter of 2010, net income increased by $19.5 million mainly due to higher service operating
income before amortization and lower amortization. Net income declined by $36.6 million in the
fourth quarter of 2010 mainly due to lower service operating income before amortization of
$12.7 million and higher amortization expense of $14.7 million. During the second quarter of
2009, the Company recorded a future tax recovery related to reduction in corporate income tax rates
which contributed $22.6 million to net income. Net income declined by $24.4 million in the third
quarter of 2009 primarily due to the tax recovery recorded in the immediately preceding quarter.
The decline in net income in the fourth quarter of 2009 of $7.9 million is mainly due to an increase
in amortization expense. As a result of the aforementioned changes in net income, basic and diluted
earnings per share have trended accordingly.
The following factors further assist in explaining the trend of quarterly service revenue and service
operating income before amortization:
Growth in subscriber statistics as follows:
Subscriber Statistics First Second Third Fourth First Second Third Fourth
2010 2009
Basic cable customers (1,416) (1,055) 2,322 2,559 9,198 4,273 9,622 6,374
Digital customers 88,259 98,544 87,092 54,946 60,717 106,489 110,810 110,501
Internet customers 36,242 26,735 25,661 21,374 31,152 26,130 24,625 27,376
Digital Phone lines 61,461 54,922 66,123 51,896 56,597 50,848 54,633 55,708
DTH 1,097 1,071 1,856 831 448 3,657 1,580 2,728
45
Shaw Communications Inc.
MANAGEMENT’S DISCUSSION AND ANALYSIS
August 31, 2010