Shaw 2010 Annual Report Download - page 57
Download and view the complete annual report
Please find page 57 of the 2010 Shaw annual report below. You can navigate through the pages in the report by either clicking on the pages listed below, or by using the keyword search tool below to find specific information within the annual report.-
 1
1 -
2
-
3
-
4
-
5
-
6
-
7
-
8
-
9
-
10
-
11
-
12
-
13
-
14
-
15
-
16
-
17
-
18
-
19
-
20
-
21
-
22
-
23
-
24
-
25
-
26
-
27
-
28
-
29
-
30
-
31
-
32
-
33
-
34
-
35
-
36
-
37
-
38
-
39
-
40
-
41
-
42
-
43
-
44
-
45
-
46
-
 47
47 -
 48
48 -
 49
49 -
 50
50 -
 51
51 -
 52
52 -
 53
53 -
 54
54 -
 55
55 -
 56
56 -
 57
57 -
 58
58 -
 59
59 -
 60
60 -
 61
61 -
 62
62 -
 63
63 -
 64
64 -
 65
65 -
 66
66 -
 67
67 -
68
-
69
-
70
-
71
-
72
-
73
-
74
-
75
-
76
-
77
-
78
-
79
-
80
-
81
-
82
-
83
-
84
-
85
-
86
-
87
-
88
-
89
-
90
-
91
-
92
-
93
-
94
-
95
-
96
-
97
-
98
-
99
-
100
-
101
-
102
-
103
-
104
-
105
-
106
-
107
-
108
-
109
-
110
-
111
-
112
-
113
-
114
-
115
-
116
-
117
-
118
-
119
-
120
-
121
-
122
-
123
-
124
-
125
-
126
 |
 |

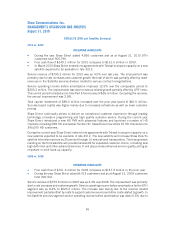
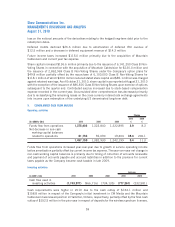
The Digital Phone footprint grew during 2009 with launches in various markets including Prince
George, British Columbia and its surrounding areas, as well as expansions in the surrounding areas
of Red Deer, Lethbridge, and Edmonton, all in Alberta. As at August 31, 2009 the Digital Phone
service was available to 94% of Basic customers and over 38% were taking the service.
Internet speed increases of 50 per cent were implemented during 2009 as well as a new 100 Mbps
service, High-Speed Nitro, using DOCSIS 3.0 technology. As of August 31, 2009 the new 100 Mbps
service was available in Saskatoon, Victoria and Winnipeg. Internet penetration of Basic continues to
be one of the highest in North America and was 73.3% up from 69.5% at August 31, 2008.
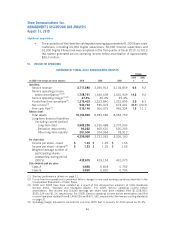
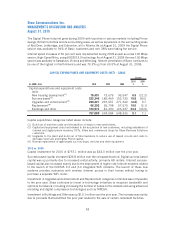
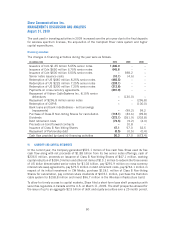
CAPITAL EXPENDITURES AND EQUIPMENT COSTS (NET) – CABLE
(In $000’s Cdn) 2010 2009 2008
2010
%
2009
%
Change
Capital expenditures and equipment costs
(net):
New housing development
(1)
78,451 73,676 93,547 6.5 (21.2)
Success-based
(2)
222,246 185,469 102,735 19.8 80.5
Upgrades and enhancement
(3)
289,421 297,651 271,242 (2.8) 9.7
Replacement
(4)
66,393 55,798 57,575 19.0 (3.1)
Buildings and other 100,574 81,490 123,237 23.4 (33.9)
757,085 694,084 648,336 9.1 7.1
Capital expenditure categories listed above include:
(1) Build out of mainline cable and the addition of drops in new subdivisions.
(2) Capital and equipment costs (net) related to the acquisition of new customers, including installation of
internet and digital phone modems, DCTs, filters and commercial drops for Shaw Business Solutions
customers.
(3) Upgrades to the plant and build out of fibre backbone to reduce use of leased circuits and costs to
decrease node size and Digital Phone capital.
(4) Normal replacement of aged assets such as drops, vehicles and other equipment.
2010 vs. 2009
Capital investment for 2010 of $757.1 million was up $63.0 million over the prior year.
Success-based capital increased $36.8 million over the comparable period. Digital success-based
capital was up primarily due to increased rental activity, primarily HD rentals. Internet success-
based capital also increased mainly due to the deployment of higher cost Internet modems related
to the launch of the DOCSIS 2.0 and 3.0 integrated WiFi modems. The launch of these new
modems provides customers with wireless Internet access in their homes without having to
purchase a separate WiFi router.
Investment in Upgrades and enhancement and Replacement categories combined was comparable
to the prior year. Shaw continues to invest in technology initiatives to recapture bandwidth and
optimize its network, including increasing the number of nodes on the network and using advanced
encoding and digital compression technologies such as MPEG4.
Investment in Buildings and Other was up $19.1 million over the prior year. The increase was mainly
due to proceeds that benefitted the prior year related to the sale of certain redundant facilities.
53
Shaw Communications Inc.
MANAGEMENT’S DISCUSSION AND ANALYSIS
August 31, 2010