Shaw 2010 Annual Report Download - page 55
Download and view the complete annual report
Please find page 55 of the 2010 Shaw annual report below. You can navigate through the pages in the report by either clicking on the pages listed below, or by using the keyword search tool below to find specific information within the annual report.-
 1
1 -
2
-
3
-
4
-
5
-
6
-
7
-
8
-
9
-
10
-
11
-
12
-
13
-
14
-
15
-
16
-
17
-
18
-
19
-
20
-
21
-
22
-
23
-
24
-
25
-
26
-
27
-
28
-
29
-
30
-
31
-
32
-
33
-
34
-
35
-
36
-
37
-
38
-
39
-
40
-
41
-
42
-
43
-
44
-
 45
45 -
 46
46 -
 47
47 -
 48
48 -
 49
49 -
 50
50 -
 51
51 -
 52
52 -
 53
53 -
 54
54 -
 55
55 -
 56
56 -
 57
57 -
 58
58 -
 59
59 -
 60
60 -
 61
61 -
 62
62 -
 63
63 -
 64
64 -
 65
65 -
66
-
67
-
68
-
69
-
70
-
71
-
72
-
73
-
74
-
75
-
76
-
77
-
78
-
79
-
80
-
81
-
82
-
83
-
84
-
85
-
86
-
87
-
88
-
89
-
90
-
91
-
92
-
93
-
94
-
95
-
96
-
97
-
98
-
99
-
100
-
101
-
102
-
103
-
104
-
105
-
106
-
107
-
108
-
109
-
110
-
111
-
112
-
113
-
114
-
115
-
116
-
117
-
118
-
119
-
120
-
121
-
122
-
123
-
124
-
125
-
126
 |
 |

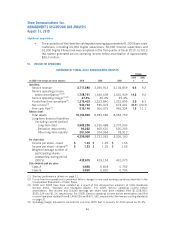
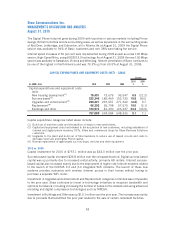
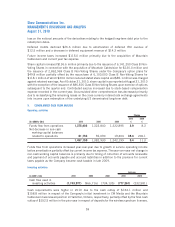
SEGMENTED OPERATIONS REVIEW
CABLE
FINANCIAL HIGHLIGHTS
($000’s Cdn) 2010 2009
(3)
2008
(3)
2010
%
2009
%
Change
Service revenue (third party) 2,927,411 2,630,982 2,375,586 11.3 10.8
Service operating income before
amortization
(1)
1,456,827 1,271,279 1,155,967 14.6 10.0
Less:
Interest 213,898 209,438 199,600 2.1 4.9
Cash taxes on net income 136,000 23,300 – H100.0 100.0
Cash flow before the following: 1,106,929 1,038,541 956,367 6.6 8.6
Capital expenditures and equipment
costs (net) 757,085 694,084 648,336 9.1 7.1
Free cash flow before the following
Add back: 349,844 344,457 308,031 1.6 11.8
Non-cash stock-based
compensation 16,210 ––100.0 –
Free cash flow
(1)
366,054 344,457 308,031 6.3 11.8
Operating margin
(1)(2)
49.8% 48.3% 48.7% 1.5 (0.4)
(1) See key performance drivers on page 21.
(2) Operating margin adjusted to exclude the one-time CRTC Part II recovery for 2010 would be 48.1%.
(3) 2009 and 2008 have been restated as a result of the retrospective adoption of CICA Handbook
Section 3064, “Goodwill and Intangible Assets”. For 2009, Service operating income before
amortization and Free cash flow have been restated from $1,269,620, and $342,798, respectively.
For 2008, Service operating income before amortization and Free Cash flow have been restated from
$1,153,274 and $305,338, respectively. See new accounting standards on page 31.
2010 vs. 2009
OPERATING HIGHLIGHTS
kShaw’s Digital subscriber base continued to grow adding 328,841 new customers.
Penetration of Basic is now 70.7%, up from 56.7% at August 31, 2009.
kDigital Phone lines increased 234,402 during the year to 1,096,306 lines and Internet was
up 110,012 to total 1,818,347 as at August 31, 2010. Basic cable subscribers were up
2,410.
kDuring the year the Company completed the acquisition of Mountain Cablevision operating in
Hamilton, Ontario adding approximately 41,000 Basic cable customers, including 24,000
Digital subscribers, 30,000 Internet subscribers, and 32,000 Digital Phone lines.
Cable service revenue for the year improved 11.3% to $2.93 billion over the last year. Customer
growth, including acquisitions, and rate increases accounted for the improvement. Service
operating income before amortization of $1.46 billion increased 14.6%. The increase was mainly
due to the revenue driven improvements, partially offset by higher employee related and other costs
51
Shaw Communications Inc.
MANAGEMENT’S DISCUSSION AND ANALYSIS
August 31, 2010