Shaw 2010 Annual Report Download - page 107
Download and view the complete annual report
Please find page 107 of the 2010 Shaw annual report below. You can navigate through the pages in the report by either clicking on the pages listed below, or by using the keyword search tool below to find specific information within the annual report.-
 1
1 -
2
-
3
-
4
-
5
-
6
-
7
-
8
-
9
-
10
-
11
-
12
-
13
-
14
-
15
-
16
-
17
-
18
-
19
-
20
-
21
-
22
-
23
-
24
-
25
-
26
-
27
-
28
-
29
-
30
-
31
-
32
-
33
-
34
-
35
-
36
-
37
-
38
-
39
-
40
-
41
-
42
-
43
-
44
-
45
-
46
-
47
-
48
-
49
-
50
-
51
-
52
-
53
-
54
-
55
-
56
-
57
-
58
-
59
-
60
-
61
-
62
-
63
-
64
-
65
-
66
-
67
-
68
-
69
-
70
-
71
-
72
-
73
-
74
-
75
-
76
-
77
-
78
-
79
-
80
-
81
-
82
-
83
-
84
-
85
-
86
-
87
-
88
-
89
-
90
-
91
-
92
-
93
-
94
-
95
-
96
-
 97
97 -
 98
98 -
 99
99 -
 100
100 -
 101
101 -
 102
102 -
 103
103 -
 104
104 -
 105
105 -
 106
106 -
 107
107 -
 108
108 -
 109
109 -
 110
110 -
 111
111 -
 112
112 -
 113
113 -
 114
114 -
 115
115 -
 116
116 -
 117
117 -
118
-
119
-
120
-
121
-
122
-
123
-
124
-
125
-
126
 |
 |

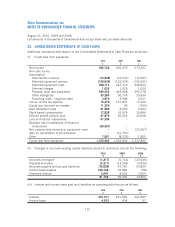
The table below shows the components of the net benefit plan expense.
2010
$
2009
$
2008
$
Current service cost 5,448 5,002 4,610
Interest cost 13,557 11,817 8,931
Past service cost 12,057 ––
Actuarial losses (gains) 49,321 (4,507) 14,211
Difference between amortization of actuarial loss
recognized for the year and actual actuarial loss on
the accrued benefit obligation for the year (43,834) 10,357 (9,067)
Difference between amortization of past service costs
recognized for the year and actual past service costs
on the accrued benefit obligation for the year (7,226) 4,831 4,831
Pension expense 29,323 27,500 23,516
The actuarial losses (gains) resulted primarily from changes in interest rate assumptions, salary
escalation assumptions, and changes in the mortality table. The past service costs result from
amendments to the plan, including new entrants.
The table below shows the expected benefit payments in each of the next five fiscal years as
actuarially determined, and in aggregate, for the five fiscal years thereafter:
$
2011 1,448
2012 1,431
2013 5,993
2014 7,056
2015 12,527
2016 – 2020 63,206
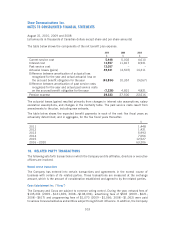
18. RELATED PARTY TRANSACTIONS
The following sets forth transactions in which the Company and its affiliates, directors or executive
officers are involved.
Normal course transactions
The Company has entered into certain transactions and agreements in the normal course of
business with certain of its related parties. These transactions are measured at the exchange
amount, which is the amount of consideration established and agreed to by the related parties.
Corus Entertainment Inc. (“Corus”)
The Company and Corus are subject to common voting control. During the year, network fees of
$135,334 (2009 – $121,659; 2008 – $108,094), advertising fees of $502 (2009 – $621;
2008 – $617) and programming fees of $1,070 (2009 – $1,066; 2008 – $1,062) were paid
to various Corus subsidiaries and entities subject to significant influence. In addition, the Company
103
Shaw Communications Inc.
NOTES TO CONSOLIDATED FINANCIAL STATEMENTS
August 31, 2010, 2009 and 2008
[all amounts in thousands of Canadian dollars except share and per share amounts]