Shaw 2010 Annual Report Download - page 103
Download and view the complete annual report
Please find page 103 of the 2010 Shaw annual report below. You can navigate through the pages in the report by either clicking on the pages listed below, or by using the keyword search tool below to find specific information within the annual report.-
 1
1 -
2
-
3
-
4
-
5
-
6
-
7
-
8
-
9
-
10
-
11
-
12
-
13
-
14
-
15
-
16
-
17
-
18
-
19
-
20
-
21
-
22
-
23
-
24
-
25
-
26
-
27
-
28
-
29
-
30
-
31
-
32
-
33
-
34
-
35
-
36
-
37
-
38
-
39
-
40
-
41
-
42
-
43
-
44
-
45
-
46
-
47
-
48
-
49
-
50
-
51
-
52
-
53
-
54
-
55
-
56
-
57
-
58
-
59
-
60
-
61
-
62
-
63
-
64
-
65
-
66
-
67
-
68
-
69
-
70
-
71
-
72
-
73
-
74
-
75
-
76
-
77
-
78
-
79
-
80
-
81
-
82
-
83
-
84
-
85
-
86
-
87
-
88
-
89
-
90
-
91
-
92
-
 93
93 -
 94
94 -
 95
95 -
 96
96 -
 97
97 -
 98
98 -
 99
99 -
 100
100 -
 101
101 -
 102
102 -
 103
103 -
 104
104 -
 105
105 -
 106
106 -
 107
107 -
 108
108 -
 109
109 -
 110
110 -
 111
111 -
 112
112 -
 113
113 -
114
-
115
-
116
-
117
-
118
-
119
-
120
-
121
-
122
-
123
-
124
-
125
-
126
 |
 |

Cable
$
Wireless
$
DTH
$
Satellite Services
$
Total
$
Total
$
Satellite
2008
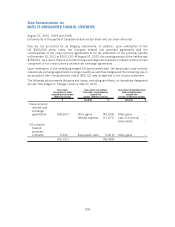
Service revenue – total 2,379,361 – 650,653 92,712 743,365 3,122,726
Intersegment (3,775) – (10,592) (3,500) (14,092) (17,867)
2,375,586 – 640,061 89,212 729,273 3,104,859
Service operating income before
amortization 1,155,967 – 206,541 48,421 254,962 1,410,929
Service operating income as % of external
revenue 48.7% – 32.3% 54.3% 35.0% 45.4%
Interest
(1)
199,600 – n/a n/a 29,599 229,199
Burrard Landing Lot 2 Holdings Partnership – 1,389
– 230,588
Cash taxes
(2)
––– – – –
Segment assets 6,460,141 190,912 869,710 523,736 1,393,446 8,044,499
Corporate assets 308,260
Total assets 8,352,759
Capital expenditures and equipment costs (net)
by segment
Capital expenditures 602,848 – 2,997 (766) 2,231 605,079
Equipment costs (net) 45,488 – 75,839 – 75,839 121,327
648,336 – 78,836 (766) 78,070 726,406
Reconciliation to Consolidated Statements of
Cash Flows
Additions to property, plant and equipment 554,387
Additions to equipment costs (net) 121,327
Additions to other intangibles 51,706
Total of capital expenditures and equipment
costs (net) per Consolidated Statements of
Cash Flows 727,420
Increase in working capital related to capital
expenditures 2,608
Less: Satellite services equipment profit
(4)
(3,622)
Total capital expenditures and equipment
costs (net) reported by segments 726,406
(1) The Company reports interest on a segmented basis for Cable, Wireless and combined satellite only. It
does not report interest on a segmented basis for DTH and Satellite Services. Interest is allocated to the
Wireless division based on the Company’s average cost of borrowing to fund the capital expenditures and
operating costs.
(2) The Company reports cash taxes on a segmented basis for Cable and combined satellite only. It does not
report cash taxes on a segmented basis for DTH and Satellite Services.
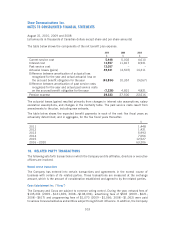
(3) The Company realized gains totaling $13,384 on cancellation of certain of its US dollar forward
purchase contracts in respect of capital expenditures and equipment costs. The gains were included in
other comprehensive income and reclassified to the initial carrying amount of capital assets or
equipment costs when the assets were recognized.
(4) The profit from the sale of satellite equipment is subtracted from the calculation of segmented capital
expenditures and equipment costs (net) as the Company views the profit on sale as a recovery of
expenditures on customer premise equipment.
99
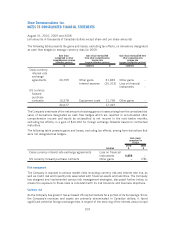
Shaw Communications Inc.
NOTES TO CONSOLIDATED FINANCIAL STATEMENTS
August 31, 2010, 2009 and 2008
[all amounts in thousands of Canadian dollars except share and per share amounts]