Shaw 2010 Annual Report Download - page 52
Download and view the complete annual report
Please find page 52 of the 2010 Shaw annual report below. You can navigate through the pages in the report by either clicking on the pages listed below, or by using the keyword search tool below to find specific information within the annual report.-
 1
1 -
2
-
3
-
4
-
5
-
6
-
7
-
8
-
9
-
10
-
11
-
12
-
13
-
14
-
15
-
16
-
17
-
18
-
19
-
20
-
21
-
22
-
23
-
24
-
25
-
26
-
27
-
28
-
29
-
30
-
31
-
32
-
33
-
34
-
35
-
36
-
37
-
38
-
39
-
40
-
41
-
 42
42 -
 43
43 -
 44
44 -
 45
45 -
 46
46 -
 47
47 -
 48
48 -
 49
49 -
 50
50 -
 51
51 -
 52
52 -
 53
53 -
 54
54 -
 55
55 -
 56
56 -
 57
57 -
 58
58 -
 59
59 -
 60
60 -
 61
61 -
 62
62 -
63
-
64
-
65
-
66
-
67
-
68
-
69
-
70
-
71
-
72
-
73
-
74
-
75
-
76
-
77
-
78
-
79
-
80
-
81
-
82
-
83
-
84
-
85
-
86
-
87
-
88
-
89
-
90
-
91
-
92
-
93
-
94
-
95
-
96
-
97
-
98
-
99
-
100
-
101
-
102
-
103
-
104
-
105
-
106
-
107
-
108
-
109
-
110
-
111
-
112
-
113
-
114
-
115
-
116
-
117
-
118
-
119
-
120
-
121
-
122
-
123
-
124
-
125
-
126
 |
 |

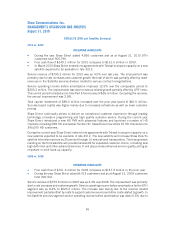
2009 vs. 2008
Consolidated service revenue of $3.39 billion for 2009 improved 9.2% over 2008. The
improvement was primarily due to customer growth and rate increases. Consolidated service
operating income before amortization improved 9.2% over the comparable period to $1.54 billion.
The increase was driven by the revenue improvements partially offset by higher employee and other
costs related to growth.
Throughout 2009 subscriber growth was solid. The Company’s focus on Digital deployment,
combined with the consumers increased demand for HDTV, drove record Digital growth during
the year. Shaw added over 388,000 new subscribers increasing its Digital penetration of Basic from
40% at August 31, 2008 to almost 57% at August 31, 2009.
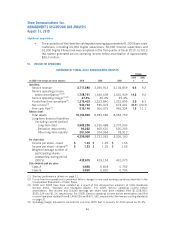
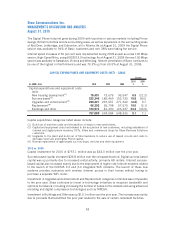
Amortization
(In $000’s Cdn) 2010 2009 2008
2010
%
2009
%
Change
Amortization revenue (expense) –
Deferred IRU revenue 12,546 12,547 12,547 ––
Deferred equipment revenue 120,639 132,974 126,601 (9.3) 5.0
Deferred equipment costs (228,714) (247,110) (228,524) (7.4) 8.1
Deferred charges (1,025) (1,025) (1,025) ––
Property, plant and equipment (526,432) (449,808) (390,778) 17.0 15.1
Other intangibles (33,285) (30,774) (23,954) 8.2 28.5
Amortization of deferred equipment revenue and deferred equipment costs decreased in 2010 due
to the sales mix of equipment, changes in customer pricing on certain equipment and the impact of
rental programs.
The increase in amortization of deferred equipment revenue and deferred equipment costs in 2009
is primarily due to the continued growth in sales of higher priced digital equipment up to February
2009, at which time the Company launched a new HD rental program as part of its focus on growing
the HD customer base.
The year over year fluctuations in amortization of property, plant and equipment and other
intangibles is due to amortization on new capital investment partially offset by the impact of
assets becoming fully depreciated.
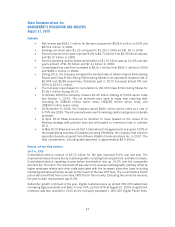
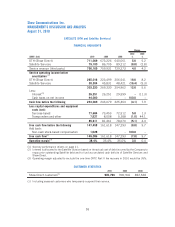
Amortization of financing costs and Interest expense
(In $000’s Cdn) 2010 2009 2008
2010
%
2009
%
Change
Amortization of financing costs –
long-term debt 3,972 3,984 3,627 (0.3) 9.8
Interest 248,011 237,047 230,588 4.6 2.8
Interest expense increased in 2010 and 2009 as a result of higher average debt levels partially
offset by a lower average cost of borrowing resulting from changes in various components of long-
term debt.
48
Shaw Communications Inc.
MANAGEMENT’S DISCUSSION AND ANALYSIS
August 31, 2010