Shaw 2010 Annual Report Download - page 50
Download and view the complete annual report
Please find page 50 of the 2010 Shaw annual report below. You can navigate through the pages in the report by either clicking on the pages listed below, or by using the keyword search tool below to find specific information within the annual report.-
 1
1 -
2
-
3
-
4
-
5
-
6
-
7
-
8
-
9
-
10
-
11
-
12
-
13
-
14
-
15
-
16
-
17
-
18
-
19
-
20
-
21
-
22
-
23
-
24
-
25
-
26
-
27
-
28
-
29
-
30
-
31
-
32
-
33
-
34
-
35
-
36
-
37
-
38
-
39
-
 40
40 -
 41
41 -
 42
42 -
 43
43 -
 44
44 -
 45
45 -
 46
46 -
 47
47 -
 48
48 -
 49
49 -
 50
50 -
 51
51 -
 52
52 -
 53
53 -
 54
54 -
 55
55 -
 56
56 -
 57
57 -
 58
58 -
 59
59 -
 60
60 -
61
-
62
-
63
-
64
-
65
-
66
-
67
-
68
-
69
-
70
-
71
-
72
-
73
-
74
-
75
-
76
-
77
-
78
-
79
-
80
-
81
-
82
-
83
-
84
-
85
-
86
-
87
-
88
-
89
-
90
-
91
-
92
-
93
-
94
-
95
-
96
-
97
-
98
-
99
-
100
-
101
-
102
-
103
-
104
-
105
-
106
-
107
-
108
-
109
-
110
-
111
-
112
-
113
-
114
-
115
-
116
-
117
-
118
-
119
-
120
-
121
-
122
-
123
-
124
-
125
-
126
 |
 |

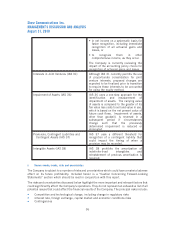
Significant acquisitions
kThe acquisition of the Hamilton cablesystem serving approximately 41,000 Basic cable
customers, including 24,000 Digital subscribers, 30,000 Internet subscribers and
32,000 Digital Phone lines was completed in the first quarter of fiscal 2010. In 2010
this system generated service operating income before amortization of approximately
$25.0 million.
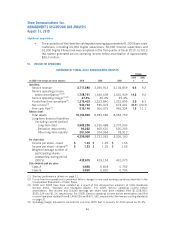
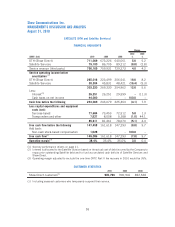
III. RESULTS OF OPERATIONS
OVERVIEW OF FISCAL 2010 CONSOLIDATED RESULTS
(In $000’s Cdn except per share amounts) 2010 2009 2008
2010
%
2009
%
Change
Operations:
Service revenue 3,717,580 3,390,913 3,104,859 9.6 9.2
Service operating income
before amortization
(1)(3)
1,758,751 1,540,609 1,410,929 14.2 9.2
Service operating margin
(1)(4)
47.3% 45.4% 45.4%
Funds flow from operations
(2)
1,375,403 1,323,840 1,222,895 3.9 8.3
Net income
(3)
532,732 536,475 673,201 (0.7) (20.3)
Free cash flow
(1)
515,140 506,075 455,324 1.8 11.1
Balance sheet:
Total assets 10,153,965 8,934,686 8,352,759
Long-term financial liabilities
(including current portion)
Long-term debt 3,982,228 3,150,488 2,707,043
Derivative instruments 86,222 465,610 520,205
Other long-term liability 291,500 104,964 78,912
4,359,950 3,721,062 3,306,160
Per share data:
Income per share – basic $ 1.23 $ 1.25 $ 1.56
Income per share – diluted
(3)
$ 1.23 $ 1.25 $ 1.55
Weighted average number of
participating shares
outstanding during period
(000’s) 432,675 429,153 431,070
Cash dividends paid per share
Class A 0.858 0.818 0.702
Class B 0.860 0.820 0.705
(1) See key performance drivers on page 21.
(2) Funds flow from operations is presented before changes in non-cash working capital as presented in the
Consolidated Statements of Cash Flows.
(3) 2009 and 2008 have been restated as a result of the retrospective adoption of CICA Handbook
Section 3064, “Goodwill and Intangible Assets”. For 2009, Service operating income before
amortization, Net income and Diluted earnings per share have been restated from $1,538,950,
$535,239 and $1.24, respectively. For 2008, Service operating income before amortization and Net
income have been restated from $1,408,236 and $671,562, respectively. See new accounting standards
on page 31.
(4) Operating margin adjusted to exclude the one-time CRTC Part II recovery for 2010 would be 45.3%.
46
Shaw Communications Inc.
MANAGEMENT’S DISCUSSION AND ANALYSIS
August 31, 2010