Shaw 2010 Annual Report Download - page 73
Download and view the complete annual report
Please find page 73 of the 2010 Shaw annual report below. You can navigate through the pages in the report by either clicking on the pages listed below, or by using the keyword search tool below to find specific information within the annual report.-
 1
1 -
2
-
3
-
4
-
5
-
6
-
7
-
8
-
9
-
10
-
11
-
12
-
13
-
14
-
15
-
16
-
17
-
18
-
19
-
20
-
21
-
22
-
23
-
24
-
25
-
26
-
27
-
28
-
29
-
30
-
31
-
32
-
33
-
34
-
35
-
36
-
37
-
38
-
39
-
40
-
41
-
42
-
43
-
44
-
45
-
46
-
47
-
48
-
49
-
50
-
51
-
52
-
53
-
54
-
55
-
56
-
57
-
58
-
59
-
60
-
61
-
62
-
 63
63 -
 64
64 -
 65
65 -
 66
66 -
 67
67 -
 68
68 -
 69
69 -
 70
70 -
 71
71 -
 72
72 -
 73
73 -
 74
74 -
 75
75 -
 76
76 -
 77
77 -
 78
78 -
 79
79 -
 80
80 -
 81
81 -
 82
82 -
 83
83 -
84
-
85
-
86
-
87
-
88
-
89
-
90
-
91
-
92
-
93
-
94
-
95
-
96
-
97
-
98
-
99
-
100
-
101
-
102
-
103
-
104
-
105
-
106
-
107
-
108
-
109
-
110
-
111
-
112
-
113
-
114
-
115
-
116
-
117
-
118
-
119
-
120
-
121
-
122
-
123
-
124
-
125
-
126
 |
 |

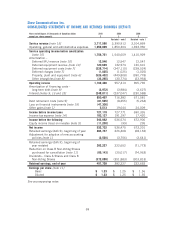
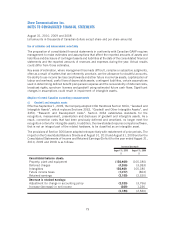
Shaw Communications Inc.
CONSOLIDATED STATEMENTS OF INCOME AND RETAINED EARNINGS (DEFICIT)
Years ended August 31 [thousands of Canadian dollars
except per share amounts]
2010
$
2009
$
2008
$
Restated – note 1 Restated – note 1
Service revenue [note 15] 3,717,580 3,390,913 3,104,859
Operating, general and administrative expenses 1,958,829 1,850,304 1,693,930
Service operating income before amortization
[note 15] 1,758,751 1,540,609 1,410,929
Amortization –
Deferred IRU revenue [note 10] 12,546 12,547 12,547
Deferred equipment revenue [note 10] 120,639 132,974 126,601
Deferred equipment costs [note 7] (228,714) (247,110) (228,524)
Deferred charges [note 7] (1,025) (1,025) (1,025)
Property, plant and equipment [note 6] (526,432) (449,808) (390,778)
Other intangibles [note 8] (33,285) (30,774) (23,954)
Operating income 1,102,480 957,413 905,796
Amortization of financing costs –
long-term debt [note 9] (3,972) (3,984) (3,627)
Interest [notes 9, 13 and 15] (248,011) (237,047) (230,588)
850,497 716,382 671,581
Debt retirement costs [note 9] (81,585) (8,255) (5,264)
Loss on financial instruments [note 19] (47,306) ––
Other gains [note 1] 5,513 19,644 24,009
Income before income taxes 727,119 727,771 690,326
Income tax expense [note 14] 183,137 191,197 17,420
Income before the following 543,982 536,574 672,906
Equity income (loss) on investee [note 5] (11,250) (99) 295
Net income 532,732 536,475 673,201
Retained earnings (deficit), beginning of year 384,747 226,408 (68,132)
Adjustment for adoption of new accounting
policies [note 1] (2,520) (3,756) (3,641)
Retained earnings (deficit), beginning of
year restated 382,227 222,652 (71,773)
Reduction on Class B Non-Voting Shares
purchased for cancellation [note 11] (85,143) (25,017) (74,963)
Dividends – Class A Shares and Class B
Non-Voting Shares (372,088) (351,883) (303,813)
Retained earnings, end of year 457,728 382,227 222,652
Earnings per share [note 11]
Basic $ 1.23 $ 1.25 $ 1.56
Diluted $ 1.23 $ 1.25 $ 1.55
See accompanying notes
69