Shaw 2010 Annual Report Download - page 116
Download and view the complete annual report
Please find page 116 of the 2010 Shaw annual report below. You can navigate through the pages in the report by either clicking on the pages listed below, or by using the keyword search tool below to find specific information within the annual report.-
 1
1 -
2
-
3
-
4
-
5
-
6
-
7
-
8
-
9
-
10
-
11
-
12
-
13
-
14
-
15
-
16
-
17
-
18
-
19
-
20
-
21
-
22
-
23
-
24
-
25
-
26
-
27
-
28
-
29
-
30
-
31
-
32
-
33
-
34
-
35
-
36
-
37
-
38
-
39
-
40
-
41
-
42
-
43
-
44
-
45
-
46
-
47
-
48
-
49
-
50
-
51
-
52
-
53
-
54
-
55
-
56
-
57
-
58
-
59
-
60
-
61
-
62
-
63
-
64
-
65
-
66
-
67
-
68
-
69
-
70
-
71
-
72
-
73
-
74
-
75
-
76
-
77
-
78
-
79
-
80
-
81
-
82
-
83
-
84
-
85
-
86
-
87
-
88
-
89
-
90
-
91
-
92
-
93
-
94
-
95
-
96
-
97
-
98
-
99
-
100
-
101
-
102
-
103
-
104
-
105
-
 106
106 -
 107
107 -
 108
108 -
 109
109 -
 110
110 -
 111
111 -
 112
112 -
 113
113 -
 114
114 -
 115
115 -
 116
116 -
 117
117 -
 118
118 -
 119
119 -
 120
120 -
 121
121 -
 122
122 -
 123
123 -
 124
124 -
 125
125 -
 126
126
 |
 |

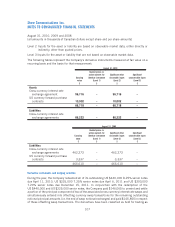
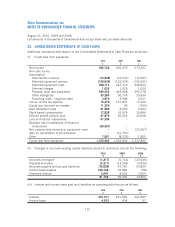
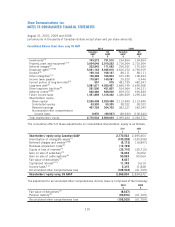
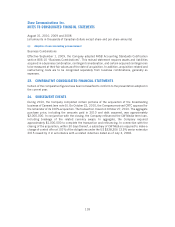
20. CONSOLIDATED STATEMENTS OF CASH FLOWS
Additional disclosures with respect to the Consolidated Statements of Cash Flows are as follows:
(i) Funds flow from operations
2010
$
2009
$
2008
$
Net income 532,732 536,475 673,201
Non-cash items:
Amortization –
Deferred IRU revenue (12,546) (12,547) (12,547)
Deferred equipment revenue (120,639) (132,974) (126,601)
Deferred equipment costs 228,714 247,110 228,524
Deferred charges 1,025 1,025 1,025
Property, plant and equipment 526,432 449,808 390,778
Other intangibles 33,285 30,774 23,954
Financing costs – long-term debt 3,972 3,984 3,627
Future income tax expense 15,370 167,897 17,420
Equity loss (income) on investee 11,250 99 (295)
Debt retirement costs 81,585 8,255 5,264
Stock-based compensation 17,838 16,974 16,894
Defined benefit pension plan 27,875 26,052 22,068
Loss on financial instruments 47,306 ––
Realized loss on settlement of financial
instruments (26,357) ––
Net customs duty recovery on equipment costs –– (22,267)
Gain on cancellation of bond forward –(10,757) –
Other 7,561 (8,335) 1,850
Funds flow from operations 1,375,403 1,323,840 1,222,895
(ii) Changes in non-cash working capital balances related to operations include the following:
2010
$
2009
$
2008
$
Accounts receivable (1,217) (5,714) (32,646)
Prepaids and other (2,211) (14,393) (9,900)
Accounts payable and accrued liabilities (76,608) 47,781 54,839
Income taxes payable 156,748 22,894 (58)
Unearned revenue 5,044 8,522 7,069
81,756 59,090 19,304
(iii) Interest and income taxes paid and classified as operating activities are as follows:
2010
$
2009
$
2008
$
Interest 237,377 231,594 241,899
Income taxes 4,243 404 57
112
Shaw Communications Inc.
NOTES TO CONSOLIDATED FINANCIAL STATEMENTS
August 31, 2010, 2009 and 2008
[all amounts in thousands of Canadian dollars except share and per share amounts]