Shaw 2010 Annual Report Download - page 33
Download and view the complete annual report
Please find page 33 of the 2010 Shaw annual report below. You can navigate through the pages in the report by either clicking on the pages listed below, or by using the keyword search tool below to find specific information within the annual report.-
 1
1 -
2
-
3
-
4
-
5
-
6
-
7
-
8
-
9
-
10
-
11
-
12
-
13
-
14
-
15
-
16
-
17
-
18
-
19
-
20
-
21
-
22
-
 23
23 -
 24
24 -
 25
25 -
 26
26 -
 27
27 -
 28
28 -
 29
29 -
 30
30 -
 31
31 -
 32
32 -
 33
33 -
 34
34 -
 35
35 -
 36
36 -
 37
37 -
 38
38 -
 39
39 -
 40
40 -
 41
41 -
 42
42 -
 43
43 -
44
-
45
-
46
-
47
-
48
-
49
-
50
-
51
-
52
-
53
-
54
-
55
-
56
-
57
-
58
-
59
-
60
-
61
-
62
-
63
-
64
-
65
-
66
-
67
-
68
-
69
-
70
-
71
-
72
-
73
-
74
-
75
-
76
-
77
-
78
-
79
-
80
-
81
-
82
-
83
-
84
-
85
-
86
-
87
-
88
-
89
-
90
-
91
-
92
-
93
-
94
-
95
-
96
-
97
-
98
-
99
-
100
-
101
-
102
-
103
-
104
-
105
-
106
-
107
-
108
-
109
-
110
-
111
-
112
-
113
-
114
-
115
-
116
-
117
-
118
-
119
-
120
-
121
-
122
-
123
-
124
-
125
-
126
 |
 |

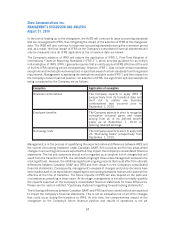
the broadcast rights for each reporting unit or wireless assets as at March 1, 2010 would not result
in any impairment loss. Further, any changes in economic conditions since the impairment testing
conducted as at March 1, 2010 do not represent events or changes in circumstance that would be
indicative of impairment at August 31, 2010.
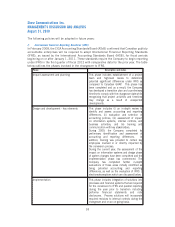
Significant estimates inherent to this analysis include discount rates and the terminal value. At
March 1, 2010, the estimates that have been utilized in the impairment tests reflect any changes in
market conditions and are as follows:
Discount Rate Terminal Growth Rate
Terminal Service
Operating Income
before Amortization
Multiple
Terminal Value
Cable systems 9.0% 2.0% 5.5x
DTH and satellite services 11.0% 1.5% 5.0x
Wireless assets 12.0% 2.0% 5.5x
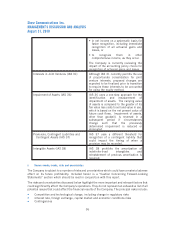
A sensitivity analysis of significant estimates is conducted as part of every impairment test. With
respect to the impairment tests performed in the third quarter, in the Cable reporting unit an
increase in the discount rate of 1% would cause the fair value to decline by less than 13%, a 1%
decrease in the terminal growth rate would cause the fair value to decline by less than 10%, and a
0.5 times reduction in the terminal service operating income before amortization multiple would
cause the fair value to decline by less than 7%. With respect to the DTH and Satellite services
reporting unit, an increase in the discount rate of 1% would cause the fair value to decline by less
than 10%, a 1% decrease in the terminal growth rate would cause the fair value to decline by less
than 7%, and a 0.5 times reduction in the terminal service operating income before amortization
multiple would cause the fair value to decline by less than 7%. With respect to wireless assets, an
increase in the discount rate of 1% would cause the fair value to decline by less than 35%, a 1%
decrease in the terminal growth rate would cause the fair value to decline by less than 19%, and a
0.5 times reduction in the terminal service operating income before amortization multiple would
cause the fair value to decline by less than 16%.
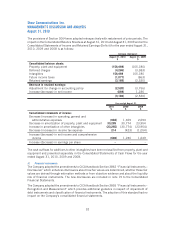
2010
$
2009
$
Carrying amount
Broadcast rights
Cable systems 4,078,021 3,833,021
DTH and satellite services 983,132 983,132
5,061,153 4,816,153
Goodwill
Non-regulated satellite services 88,111 88,111
Cable system 81,032 –
169,143 88,111
Wireless spectrum licenses 190,912 –
Net book value 5,421,208 4,904,264
viii) Employment benefit plans
Shaw has a defined benefit pension plan for key senior executives. The amounts reported in the
financial statements relating to the defined benefit pension plan are determined using actuarial
valuations that are based on several assumptions. The valuation uses management’s assumptions
29
Shaw Communications Inc.
MANAGEMENT’S DISCUSSION AND ANALYSIS
August 31, 2010