Shaw 2010 Annual Report Download - page 58
Download and view the complete annual report
Please find page 58 of the 2010 Shaw annual report below. You can navigate through the pages in the report by either clicking on the pages listed below, or by using the keyword search tool below to find specific information within the annual report.-
 1
1 -
2
-
3
-
4
-
5
-
6
-
7
-
8
-
9
-
10
-
11
-
12
-
13
-
14
-
15
-
16
-
17
-
18
-
19
-
20
-
21
-
22
-
23
-
24
-
25
-
26
-
27
-
28
-
29
-
30
-
31
-
32
-
33
-
34
-
35
-
36
-
37
-
38
-
39
-
40
-
41
-
42
-
43
-
44
-
45
-
46
-
47
-
 48
48 -
 49
49 -
 50
50 -
 51
51 -
 52
52 -
 53
53 -
 54
54 -
 55
55 -
 56
56 -
 57
57 -
 58
58 -
 59
59 -
 60
60 -
 61
61 -
 62
62 -
 63
63 -
 64
64 -
 65
65 -
 66
66 -
 67
67 -
 68
68 -
69
-
70
-
71
-
72
-
73
-
74
-
75
-
76
-
77
-
78
-
79
-
80
-
81
-
82
-
83
-
84
-
85
-
86
-
87
-
88
-
89
-
90
-
91
-
92
-
93
-
94
-
95
-
96
-
97
-
98
-
99
-
100
-
101
-
102
-
103
-
104
-
105
-
106
-
107
-
108
-
109
-
110
-
111
-
112
-
113
-
114
-
115
-
116
-
117
-
118
-
119
-
120
-
121
-
122
-
123
-
124
-
125
-
126
 |
 |

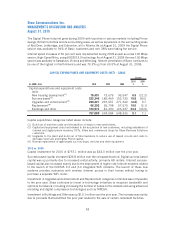
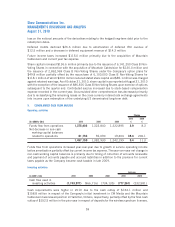
2009 vs. 2008
Total capital investment of $694.1 million during 2009 increased $45.7 million over the
comparable period.
Spending in new housing development for 2009 declined $19.9 million over 2008 mainly due to
reduced activity.
Success-based capital increased $82.7 million over the comparable period primarily due to higher
Digital success-based capital related to increased customer activations associated with the new
rental strategy and lower customer pricing of certain equipment. Internet and Digital Phone
success-based capital was also up as the 2009 year included higher investment mainly due to
bulk purchases of equipment at the end of the year as well as increased activity.
Investment in the upgrades and enhancement category and replacement category combined was up
$24.6 million compared to 2008. The 2009 period included higher spending on Internet projects
to enhance the speed of Shaw’s various Internet offerings partially offset by lower investment on
Digital Phone related capital.
Investment in Buildings and other declined $41.7 million compared to 2008. The lower spend was
primarily due to higher investment in 2008 in various facilities projects, including the purchase of a
property in Calgary adjacent to existing Company owned facilities, partially offset by increased
investment in 2009 on IT projects to upgrade back office and customer support systems. The
2009 year also benefitted from proceeds on the sale of redundant facilities.
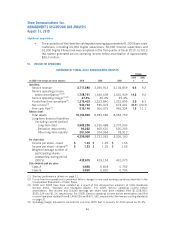
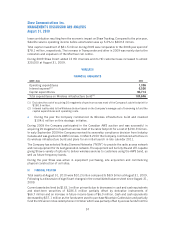
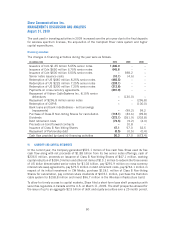
SUBSCRIBER STATISTICS
2010 2009
(1)
2008
(1)
Growth
Change
% Growth
Change
%
2010 2009
CABLE:
Basic subscribers 2,333,438 2,331,028 2,301,561 2,410 0.1 29,467 1.3
Penetration as a % of
homes passed 61.4% 62.9% 63.5%
Digital customers 1,650,565 1,321,724 933,207 328,841 24.9 388,517 41.6
INTERNET:
Connected and scheduled
installations 1,818,347 1,708,335 1,599,052 110,012 6.4 109,283 6.8
Penetration as % of basic 77.9% 73.3% 69.5%
Stand-alone Internet not
included in basic cable 233,159 238,710 217,339 (5,551) (2.3) 21,371 9.8
DIGITAL PHONE:
Number of lines
(2)
1,096,306 861,904 644,118 234,402 27.2 217,786 33.8
(1) August 31, 2009 and August 31, 2008 are restated for comparative purposes as if the acquisition of the
Mountain Cablevision system in Hamilton, Ontario had occurred on that date.
(2) Represents primary and secondary lines on billing plus pending installs.
54
Shaw Communications Inc.
MANAGEMENT’S DISCUSSION AND ANALYSIS
August 31, 2010