Shaw 2010 Annual Report Download - page 26
Download and view the complete annual report
Please find page 26 of the 2010 Shaw annual report below. You can navigate through the pages in the report by either clicking on the pages listed below, or by using the keyword search tool below to find specific information within the annual report.-
 1
1 -
2
-
3
-
4
-
5
-
6
-
7
-
8
-
9
-
10
-
11
-
12
-
13
-
14
-
15
-
 16
16 -
 17
17 -
 18
18 -
 19
19 -
 20
20 -
 21
21 -
 22
22 -
 23
23 -
 24
24 -
 25
25 -
 26
26 -
 27
27 -
 28
28 -
 29
29 -
 30
30 -
 31
31 -
 32
32 -
 33
33 -
 34
34 -
 35
35 -
 36
36 -
37
-
38
-
39
-
40
-
41
-
42
-
43
-
44
-
45
-
46
-
47
-
48
-
49
-
50
-
51
-
52
-
53
-
54
-
55
-
56
-
57
-
58
-
59
-
60
-
61
-
62
-
63
-
64
-
65
-
66
-
67
-
68
-
69
-
70
-
71
-
72
-
73
-
74
-
75
-
76
-
77
-
78
-
79
-
80
-
81
-
82
-
83
-
84
-
85
-
86
-
87
-
88
-
89
-
90
-
91
-
92
-
93
-
94
-
95
-
96
-
97
-
98
-
99
-
100
-
101
-
102
-
103
-
104
-
105
-
106
-
107
-
108
-
109
-
110
-
111
-
112
-
113
-
114
-
115
-
116
-
117
-
118
-
119
-
120
-
121
-
122
-
123
-
124
-
125
-
126
 |
 |

FINANCIAL MEASURES:
i) Service revenue
Service revenue is a measurement determined in accordance with Canadian and US generally
accepted accounting principles (“GAAP”). It represents the inflow of cash, receivables or other
consideration arising from the sale of products and services. Service revenue is net of items such as
trade or volume discounts and certain excise and sales taxes. It is the base on which free cash flow, a
key performance driver, is determined; therefore, it measures the potential to deliver free cash flow
as well as indicating growth in a competitive market place.
The Company’s continuous disclosure documents may provide discussion and analysis of non-GAAP
financial measures. These financial measures do not have standard definitions prescribed by Canadian
or US GAAP and therefore may not be comparable to similar measures disclosed by other companies. The
Company utilizes these measures in making operating decisions and assessing its performance. Certain
investors, analysts and others utilize these measures in assessing the Company’s financial performance
and as an indicator of its ability to service debt and return cash to shareholders. These non-GAAP
measures have not been presented as an alternative to net income or any other measure of performance
or liquidity prescribed by Canadian or US GAAP. The following contains a listing of the Company’s use of
non-GAAP financial measures and provides a reconciliation to the nearest GAAP measurement or
provides a reference to such reconciliation.
ii) Service operating income before amortization and operating margin
Service operating income before amortization is calculated as service revenue less operating,
general and administrative expenses and is presented as a sub-total line item in the Consolidated
Statements of Income and Retained Earnings (Deficit). It is intended to indicate the Company’s
ability to service and/or incur debt, and therefore it is calculated before amortization (a non-cash
expense) and interest. Service operating income before amortization is also one of the measures
used by the investing community to value the business. Operating margin is calculated by dividing
service operating income before amortization by service revenue.
Relative increases period over period in service operating income before amortization and in
operating margin are indicative of the Company’s success in delivering valued products and services
to its customers in a cost-effective manner.
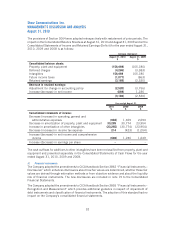
iii) Free cash flow
The Company uses free cash flow as a measure of the Company’s ability to repay debt and return
cash to shareholders. Consolidated free cash flow is calculated as follows:
($000’s Cdn) 2010 2009
(3)
2008
(3)
Cable free cash flow
(1)
366,054 344,457 308,031
Satellite free cash flow
(2)
149,086 161,618 147,293
Consolidated free cash flow 515,140 506,075 455,324
(1) The reconciliation of free cash flow for cable is provided on page 51.
(2) The reconciliation of free cash flow for satellite is provided on page 55.
(3) Free cash flow for 2009 and 2008 have not been restated to exclude stock based compensation. Cable free
cash flow for 2009 and 2008 has been restated from $342,798 and $305,338 respectively, for the
retrospective adoption of CICA Handbook Section 3064, “Goodwill and Intangible Assets”. See new
accounting standards on page 31.
Free cash flow for cable and satellite is calculated as service operating income before amortization,
less interest, cash taxes paid or payable on income, capital expenditures (on an accrual basis) and
22
Shaw Communications Inc.
MANAGEMENT’S DISCUSSION AND ANALYSIS
August 31, 2010