Shaw 2010 Annual Report Download - page 119
Download and view the complete annual report
Please find page 119 of the 2010 Shaw annual report below. You can navigate through the pages in the report by either clicking on the pages listed below, or by using the keyword search tool below to find specific information within the annual report.-
 1
1 -
2
-
3
-
4
-
5
-
6
-
7
-
8
-
9
-
10
-
11
-
12
-
13
-
14
-
15
-
16
-
17
-
18
-
19
-
20
-
21
-
22
-
23
-
24
-
25
-
26
-
27
-
28
-
29
-
30
-
31
-
32
-
33
-
34
-
35
-
36
-
37
-
38
-
39
-
40
-
41
-
42
-
43
-
44
-
45
-
46
-
47
-
48
-
49
-
50
-
51
-
52
-
53
-
54
-
55
-
56
-
57
-
58
-
59
-
60
-
61
-
62
-
63
-
64
-
65
-
66
-
67
-
68
-
69
-
70
-
71
-
72
-
73
-
74
-
75
-
76
-
77
-
78
-
79
-
80
-
81
-
82
-
83
-
84
-
85
-
86
-
87
-
88
-
89
-
90
-
91
-
92
-
93
-
94
-
95
-
96
-
97
-
98
-
99
-
100
-
101
-
102
-
103
-
104
-
105
-
106
-
107
-
108
-
 109
109 -
 110
110 -
 111
111 -
 112
112 -
 113
113 -
 114
114 -
 115
115 -
 116
116 -
 117
117 -
 118
118 -
 119
119 -
 120
120 -
 121
121 -
 122
122 -
 123
123 -
 124
124 -
 125
125 -
 126
126
 |
 |

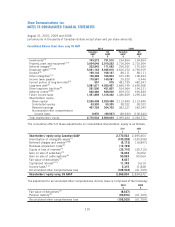
Consolidated Balance Sheet items using US GAAP
Canadian
GAAP
$
US
GAAP
$
Canadian
GAAP
$
US
GAAP
$
2010 2009
Investments
(3)
743,273 731,510 194,854 194,854
Property, plant and equipment
(10)
3,004,649 3,010,222 2,716,364 2,720,564
Deferred charges
(2)
232,843 171,093 256,355 170,260
Broadcast rights
(1)(5)(6)
5,061,153 5,035,919 4,816,153 4,790,919
Goodwill
(3)
169,143 168,167 88,111 88,111
Other intangibles
(10)
156,469 166,804 105,180 108,693
Income taxes payable 170,581 149,081 25,320 5,446
Current portion of long-term debt
(2)
557 576 481,739 482,341
Long-term debt
(2)
3,981,671 4,020,457 2,668,749 2,695,908
Other long-term liabilities
(9)
291,500 431,807 104,964 194,211
Deferred credits
(2)(8)
632,482 629,000 659,073 656,830
Future income taxes 1,451,859 1,415,442 1,336,859 1,299,244
Shareholders’ equity:
Share capital 2,250,498 2,250,498 2,113,849 2,113,849
Contributed surplus 53,330 53,330 38,022 38,022
Retained earnings 457,728 364,703 382,227 283,044
Accumulated other comprehensive
income (loss) 8,976 (99,527) (38,634) (100,343)
Total shareholders’ equity 2,770,532 2,569,004 2,495,464 2,334,572
The cumulative effect of these adjustments on consolidated shareholders’ equity is as follows:
2010
$
2009
$
Shareholders’ equity using Canadian GAAP 2,770,532 2,495,464
Amortization of intangible assets
(1)
(130,208) (130,208)
Deferred charges and credits
(2)(8)
(6,173) (16,847)
Business acquisition costs
(3)
(12,739) –
Equity in loss of investee
(4)
(35,710) (35,710)
Gain on sale of subsidiary
(5)
16,052 16,052
Gain on sale of cable systems
(6)
50,063 50,063
Fair value of derivatives
(7)
8,627 –
Capitalized interest
(10)
11,748 5,619
Income taxes
(11)
5,315 11,848
Accumulated other comprehensive loss (108,503) (61,709)
Shareholders’ equity using US GAAP 2,569,004 2,334,572
The adjustment to accumulated other comprehensive income (loss) is comprised of the following:
2010
$
2009
$
Fair value of derivatives
(7)
(8,627) –
Pension liability
(9)
(99,876) (61,709)
Accumulated other comprehensive loss (108,503) (61,709)
115
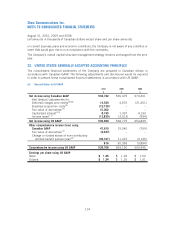
Shaw Communications Inc.
NOTES TO CONSOLIDATED FINANCIAL STATEMENTS
August 31, 2010, 2009 and 2008
[all amounts in thousands of Canadian dollars except share and per share amounts]