Shaw 2010 Annual Report Download - page 59
Download and view the complete annual report
Please find page 59 of the 2010 Shaw annual report below. You can navigate through the pages in the report by either clicking on the pages listed below, or by using the keyword search tool below to find specific information within the annual report.-
 1
1 -
2
-
3
-
4
-
5
-
6
-
7
-
8
-
9
-
10
-
11
-
12
-
13
-
14
-
15
-
16
-
17
-
18
-
19
-
20
-
21
-
22
-
23
-
24
-
25
-
26
-
27
-
28
-
29
-
30
-
31
-
32
-
33
-
34
-
35
-
36
-
37
-
38
-
39
-
40
-
41
-
42
-
43
-
44
-
45
-
46
-
47
-
48
-
 49
49 -
 50
50 -
 51
51 -
 52
52 -
 53
53 -
 54
54 -
 55
55 -
 56
56 -
 57
57 -
 58
58 -
 59
59 -
 60
60 -
 61
61 -
 62
62 -
 63
63 -
 64
64 -
 65
65 -
 66
66 -
 67
67 -
 68
68 -
 69
69 -
70
-
71
-
72
-
73
-
74
-
75
-
76
-
77
-
78
-
79
-
80
-
81
-
82
-
83
-
84
-
85
-
86
-
87
-
88
-
89
-
90
-
91
-
92
-
93
-
94
-
95
-
96
-
97
-
98
-
99
-
100
-
101
-
102
-
103
-
104
-
105
-
106
-
107
-
108
-
109
-
110
-
111
-
112
-
113
-
114
-
115
-
116
-
117
-
118
-
119
-
120
-
121
-
122
-
123
-
124
-
125
-
126
 |
 |

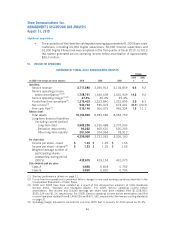
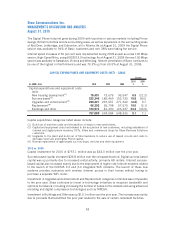
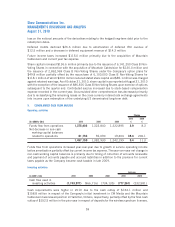
SATELLITE (DTH and Satellite Services)
FINANCIAL HIGHLIGHTS
($000’s Cdn) 2010 2009 2008
2010
%
2009
%
Change
DTH (Shaw Direct) 711,069 673,226 640,061 5.6 5.2
Satellite Services 79,100 86,705 89,212 (8.8) (2.8)
Service revenue (third party) 790,169 759,931 729,273 4.0 4.2
Service operating income before
amortization
(1)
DTH (Shaw Direct) 265,016 223,499 206,541 18.6 8.2
Satellite Services 38,304 45,831 48,421 (16.4) (5.3)
303,320 269,330 254,962 12.6 5.6
Less:
Interest
(2)
26,251 26,251 29,599 –(11.3)
Cash taxes on net income 44,000 ––100.0 –
Cash flow before the following 233,069 243,079 225,363 (4.1) 7.9
Less capital expenditures and equipment
costs (net):
Success-based 77,684 73,453 72,512 5.8 1.3
Transponders and other 7,927 8,008 5,558 (1.0) 44.1
85,611 81,461 78,070 (5.1) 4.3
Free cash flow before the following 147,458 161,618 147,293 (8.8) 9.7
Add back:
Non-cash stock-based compensation 1,628 ––100.0 –
Free cash flow
(1)
149,086 161,618 147,293 (7.8) 9.7
Operating margin
(3)
38.4% 35.4% 35.0% 3.0 0.4
(1) See key performance drivers on page 21.
(2) Interest is allocated to the Satellite division based on the actual cost of debt incurred by the Company to
repay prior outstanding Satellite debt and to fund accumulated cash deficits of Satellite Services and
Shaw Direct.
(3) Operating margin adjusted to exclude the one-time CRTC Part II fee recovery in 2010 would be 35%.
CUSTOMER STATISTICS
2010 2009 2008
Shaw Direct customers
(1)
905,796 900,941 892,528
(1) Including seasonal customers who temporarily suspend their service.
55
Shaw Communications Inc.
MANAGEMENT’S DISCUSSION AND ANALYSIS
August 31, 2010