Shaw 2010 Annual Report Download - page 102
Download and view the complete annual report
Please find page 102 of the 2010 Shaw annual report below. You can navigate through the pages in the report by either clicking on the pages listed below, or by using the keyword search tool below to find specific information within the annual report.-
 1
1 -
2
-
3
-
4
-
5
-
6
-
7
-
8
-
9
-
10
-
11
-
12
-
13
-
14
-
15
-
16
-
17
-
18
-
19
-
20
-
21
-
22
-
23
-
24
-
25
-
26
-
27
-
28
-
29
-
30
-
31
-
32
-
33
-
34
-
35
-
36
-
37
-
38
-
39
-
40
-
41
-
42
-
43
-
44
-
45
-
46
-
47
-
48
-
49
-
50
-
51
-
52
-
53
-
54
-
55
-
56
-
57
-
58
-
59
-
60
-
61
-
62
-
63
-
64
-
65
-
66
-
67
-
68
-
69
-
70
-
71
-
72
-
73
-
74
-
75
-
76
-
77
-
78
-
79
-
80
-
81
-
82
-
83
-
84
-
85
-
86
-
87
-
88
-
89
-
90
-
91
-
 92
92 -
 93
93 -
 94
94 -
 95
95 -
 96
96 -
 97
97 -
 98
98 -
 99
99 -
 100
100 -
 101
101 -
 102
102 -
 103
103 -
 104
104 -
 105
105 -
 106
106 -
 107
107 -
 108
108 -
 109
109 -
 110
110 -
 111
111 -
 112
112 -
113
-
114
-
115
-
116
-
117
-
118
-
119
-
120
-
121
-
122
-
123
-
124
-
125
-
126
 |
 |

Cable
$
Wireless
$
DTH
$
Satellite Services
$
Total
$
Total
$
Satellite
2009
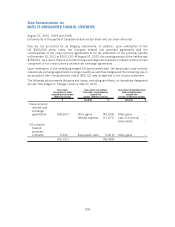
Service revenue – total 2,635,832 – 684,831 90,205 775,036 3,410,868
Intersegment (4,850) – (11,605) (3,500) (15,105) (19,955)
2,630,982 – 673,226 86,705 759,931 3,390,913
Service operating income before
amortization 1,271,279 – 223,499 45,831 269,330 1,540,609
Service operating income as % of external
revenue 48.3% – 33.2% 52.9% 35.4% 45.4%
Interest
(1)
209,438 – n/a n/a 26,251 235,689
Burrard Landing Lot 2 Holdings Partnership – 1,358
– 237,047
Cash taxes
(2)
23,300 – n/a n/a – 23,300
Segment assets 6,599,120 190,912 855,283 498,720 1,354,003 8,144,035
Corporate assets 790,651
Total assets 8,934,686
Capital expenditures and equipment costs (net)
by segment
Capital expenditures 658,862 – 4,907 192 5,099 663,961
Equipment costs (net) 35,222 – 76,362 – 76,362 111,584
694,084 – 81,269 192 81,461 775,545
Reconciliation to Consolidated Statements of
Cash Flows
Additions to property, plant and equipment 623,695
Additions to equipment costs (net) 124,968
Additions to other intangibles 54,223
Total of capital expenditures and equipment
costs (net) per Consolidated Statements of
Cash Flows 802,886
Increase in working capital related to capital
expenditures 11,559
Less: Proceeds on disposal of property, plant
and equipment (22,081)
Less: Realized gains on cancellation of US
dollar forward purchase contracts
(3)
(13,384)
Less: Satellite services equipment profit
(4)
(3,435)
Total capital expenditures and equipment
costs (net) reported by segments 775,545
See notes following 2008 business segment table.
98
Shaw Communications Inc.
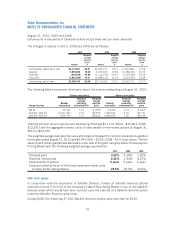
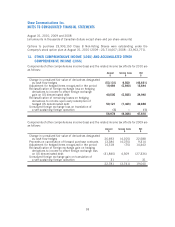
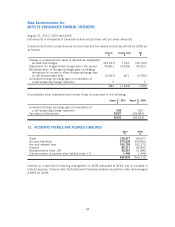
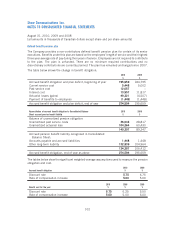
NOTES TO CONSOLIDATED FINANCIAL STATEMENTS
August 31, 2010, 2009 and 2008
[all amounts in thousands of Canadian dollars except share and per share amounts]