Shaw 2010 Annual Report Download - page 54
Download and view the complete annual report
Please find page 54 of the 2010 Shaw annual report below. You can navigate through the pages in the report by either clicking on the pages listed below, or by using the keyword search tool below to find specific information within the annual report.-
 1
1 -
2
-
3
-
4
-
5
-
6
-
7
-
8
-
9
-
10
-
11
-
12
-
13
-
14
-
15
-
16
-
17
-
18
-
19
-
20
-
21
-
22
-
23
-
24
-
25
-
26
-
27
-
28
-
29
-
30
-
31
-
32
-
33
-
34
-
35
-
36
-
37
-
38
-
39
-
40
-
41
-
42
-
43
-
 44
44 -
 45
45 -
 46
46 -
 47
47 -
 48
48 -
 49
49 -
 50
50 -
 51
51 -
 52
52 -
 53
53 -
 54
54 -
 55
55 -
 56
56 -
 57
57 -
 58
58 -
 59
59 -
 60
60 -
 61
61 -
 62
62 -
 63
63 -
 64
64 -
65
-
66
-
67
-
68
-
69
-
70
-
71
-
72
-
73
-
74
-
75
-
76
-
77
-
78
-
79
-
80
-
81
-
82
-
83
-
84
-
85
-
86
-
87
-
88
-
89
-
90
-
91
-
92
-
93
-
94
-
95
-
96
-
97
-
98
-
99
-
100
-
101
-
102
-
103
-
104
-
105
-
106
-
107
-
108
-
109
-
110
-
111
-
112
-
113
-
114
-
115
-
116
-
117
-
118
-
119
-
120
-
121
-
122
-
123
-
124
-
125
-
126
 |
 |

Note 14 to the Consolidated Financial Statements. Future income tax recoveries of $17.6 million,
$22.6 million and $188.0 million related to reductions in corporate income tax rates were recorded
in 2010, 2009 and 2008, respectively. The significant growth in net income before taxes over the
past several years has reduced the Company’s tax loss carryforwards and the company became cash
taxable in the latter part of 2009.
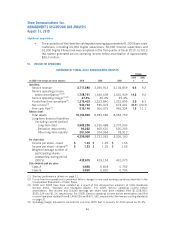
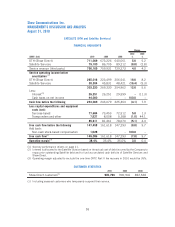
Net income per share
(In $000’s Cdn except per share amounts) 2010 2009 2008
2010
%
2009
%
Change
Net income 532,732 536,475 673,201 (0.7) (20.3)
Weighted average number of
participating shares outstanding
during period (000’s) 432,675 429,153 431,070 0.8 (0.4)
Income per share – basic $ 1.23 $ 1.25 $ 1.56 (1.6) (19.9)
Income per share – diluted $ 1.23 $ 1.25 $ 1.55 (1.6) (19.4)
Net income
Net income was $532.7 million in 2010 compared to $536.5 million in 2009 and $673.2 million
in 2008. The year-over-year changes are summarized in the table below.
In 2010 net income decreased $3.7 million compared to the prior year. The current year benefited
from higher service operating income before amortization of $218.1 million which was offset by
debt retirement costs of $81.6 million, loss on financial instruments of $47.3 million, higher
interest expense of $11.0 million, increased amortization of $73.0 million and a loss on equity
investee of $11.3 million.
In 2009 net income decreased $136.7 million compared to the prior year. The lower net income
was mainly due to decreased taxes in the prior year of $173.8 million that included a
$188.0 million future tax recovery compared to a recovery in 2009 of $22.6 million. The recoveries
were related to reductions in corporate income tax rates. In 2009 higher service operating income
before amortization of $129.7 million was partially offset by increased amortization of
$78.4 million.
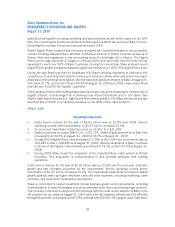
(In $millions Cdn) 2010 2009
Increased service operating income before amortization 218.1 129.7
Decreased (increased) amortization of deferred equipment costs and
revenue and IRU revenue 6.1 (12.2)
Increased amortization of deferred charges, financing costs, property,
plant and equipment, and other intangibles (79.1) (66.2)
Increased interest expense (11.0) (6.5)
Change in other net costs and revenue
(1)
(145.9) (7.7)
Decreased (increased) income taxes 8.1 (173.8)
(3.7) (136.7)
(1) Other net costs and revenue include debt retirement costs, equity income (loss) on investee, loss on
financial instruments and other gains as detailed in the Consolidated Statements of Income and Retained
Earnings (Deficit).
50
Shaw Communications Inc.
MANAGEMENT’S DISCUSSION AND ANALYSIS
August 31, 2010